How-To Guide: Embed Google Poll and Results Into Pressbooks
Naomi Salmon
Part 0: Create a Spreadsheet To Store Your Google Form Data
Step 0.1: Update your Google forms “Responses” settings
When you’re creating a Google Form, the top of the page will give you the chance to edit questions and set up how your responses will be recorded. Click on the “responses” tab to configure these options.
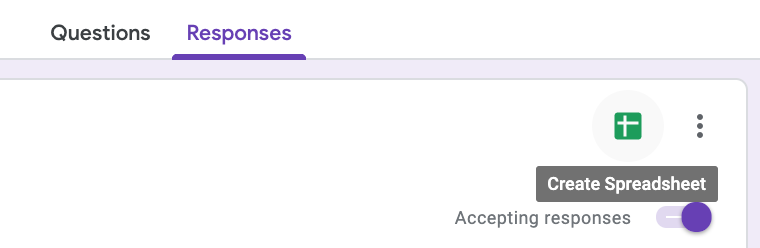
Step 0.2: Send your form responses to a spreadsheet
Click “Create Spreadsheet.”
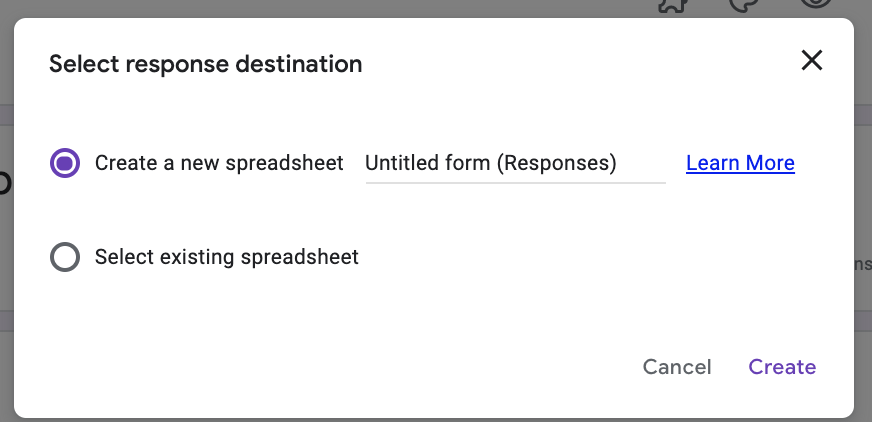
You’ll be presented with a “Select Response Destination” option. Choose the approach that works best for you — (either to create a new spreadsheet or send your answers to a spreadsheet you’ve already created).
Part 1: Embed a Google Form into your textbook (web-only)
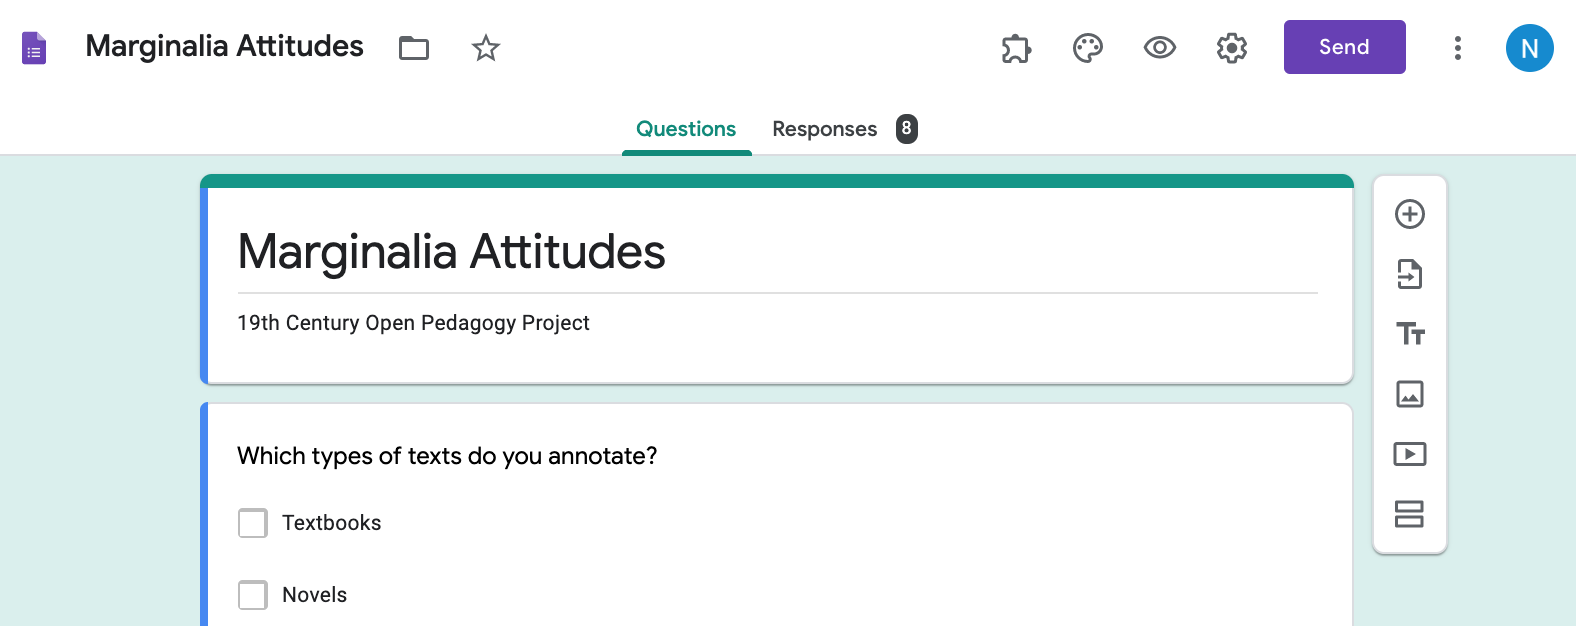
Step 1.1: Navigate to the “Send” screen in Google Forms
When you’re logged into the Google account for a form you created, you should see a “Send” button at the top of the screen. (This may take the form of a button labeled “send” or a small paper airplane icon.)
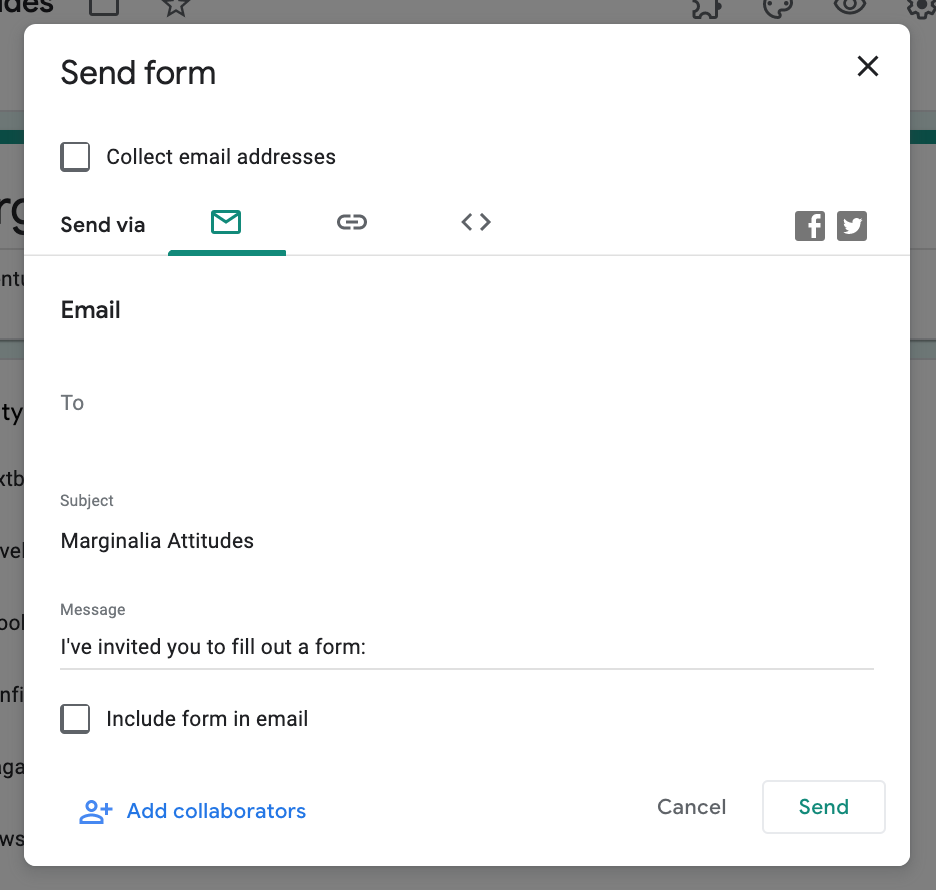
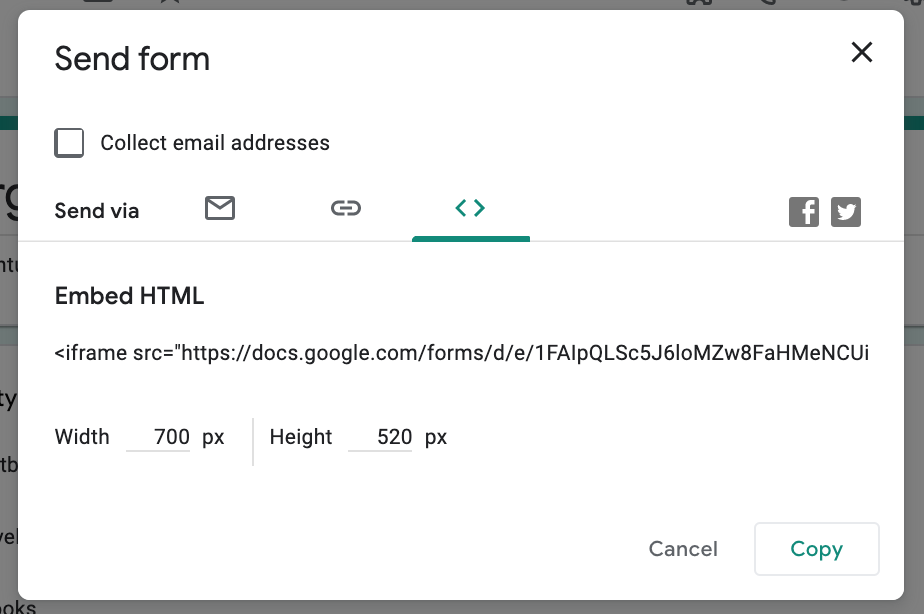
Step 1.2: Find the “Embed” section of your “Send Form” popup
Clicking on “Send Form” will take you to a screen with different tabs you can use to send your form to someone. Your “Send via” options are email, link, or embed.
Click on “Embed.”
Step 1.3: Copy the HTML embed code for your form
Once you’ve clicked “embed,” you’ll have access to HTML iframe embed code. You can change the display width and height if you choose.
Next, click “copy.”
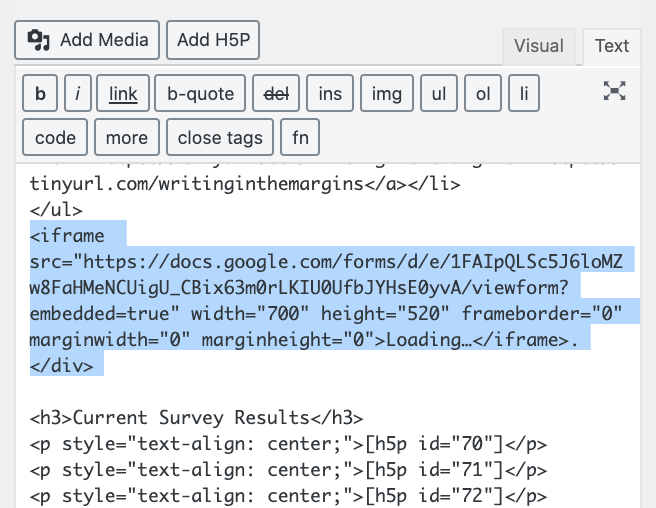
Step 1.4: Embed your form embed code into Pressbooks
Return to the editing page for the Pressbooks chapter where you want to embed your Google form.
You’ll need to paste your iframe code into the HTML text editor rather than to the visual editor. (Click on the “Text” tab in the top right of your editing panel to see the HTML editor)
Part 2: Convert Google Form Results Into Live Poll Displays
Context:
To create live form displays, you’ll need to create charts in the Google Sheets form destination you’ve created.
Here’s an example of what you might see when you open up your Google Sheets responses form:
| Timestamp | Which types of texts do you annotate? | Do you write in library books? | Which media do you use? |
For what reasons do you write in books?
|
||||
| 5/17/2019 19:34:43 | Textbooks, Novels, Ebooks, Nonfiction books | Only in pencil. | Pencil, Ink pens, Highlighter, Electronic type |
Study/notetaking, Decoration, Boredom, To focus, To mock, To express admiration, To argue, To make grocery lists, Other
|
||||
| 5/19/2019 9:53:29 | Textbooks, Ebooks, Nonfiction books, Magazines | Never! | Pencil, Ink pens, Highlighter, Electronic type, Post its |
Study/notetaking, To focus, To mock, To express admiration, To argue, Other
|
The first column (above) logs each survey response’s timestamp. The following columns detail what each respondent answered on different single-select or multiple-select questions.
The steps below will describe how to take this non-numerical information and turn it into something you can display as a graph.
Step 2.0: Identify each section you want to convert into a graph.
Context: Google Forms records information as a list within columns, but to customize charts to display information from your polls, you’ll want to create tables that record numerical information. The examples below illustrate the difference between the kinds of formatting you’ll have in your Google spreadsheet and the kind of table that will allow you to create a live, embeddable chart.
Single-Select Responses
The formatting we have:
| Response # | Do you write in library books? |
| 1 | Only in pencil. |
| 2 | Never! |
| 3 | Never! |
| 4 | Never! |
| 5 | Only in pencil. |
| 6 | Only in pencil. |
| 7 | Never! |
| 8 | Never! |
The formatting we want instead:
| Do you write in library books? (Responses) | TOTALS |
| Never! | 5 |
| Only in pencil. | 3 |
| Yes, in ink. | 0 |
Multiple-Select Responses
The formatting we have:
| Response # | Do you write in library books? |
| 1 | Study/notetaking, Decoration, Boredom, To focus, To mock, To express admiration, To argue, To make grocery lists, Other |
| 2 | Study/notetaking, To express admiration, To argue |
| 3 | Study/notetaking, To focus |
| 4 | Study/notetaking, To focus, To express admiration, To argue, Other |
| 5 | |
| 6 | Only in pencil. |
| 7 | Never! |
| 8 | Never! |
The formatting we want instead:
| For what reasons do you write in books? | TOTALS |
| Study/notetaking | 8 |
| Decoration | 1 |
| Boredom | 1 |
| To focus | 5 |
| To mock | 5 |
| To express admiration | 4 |
| To argue | 7 |
| To make grocery lists | 1 |
| Other | 4 |
Step 2.1: Create a table for each section you want to convert into a graph.
To move from the data arrangement you have to the data arrangement you want—and most importantly, to do so in a way that will automatically update when new responses come in—you can create a series of tables to the right of where Google Forms is populating your data.
For example, in the Google form spreadsheet I’m working on in this instance, form data is coming into Columns A, B, C, D, and E, so I don’t want to add any text to those columns because that’s where new form responses are going to be recorded. However, adding information to any columns past Column E (for instance, Column F, G, H, I, etc.) won’t do any harm, so I’ll use that space to add new information.
In the example below, I’ve added a series of new tables to Column J and Column K. In each table, I’ve made a row for each possible selection in my survey. (For example, “Ebooks,” “Nonfiction Books,” and “Newspapers” each gets its own row.)
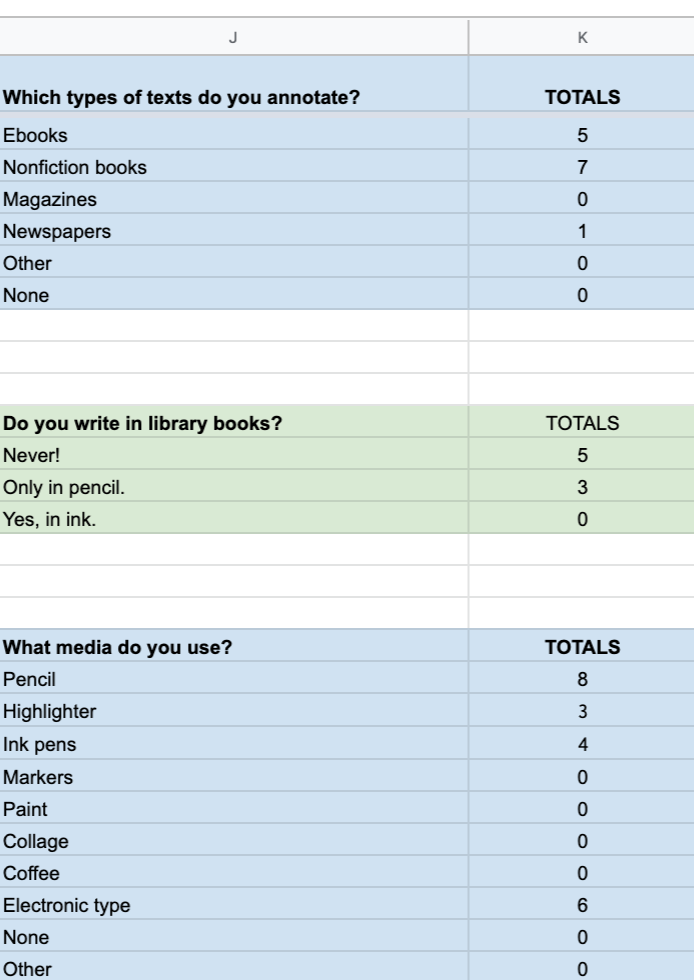
Step 2.2: Use a “COUNTIF” function to populate each “TOTALS” value cell in your survey tables.
What isn’t apparent in the screenshot above is that I haven’t counted up the examples in the TOTALS section by hand. Instead, I’ve used a Google Sheets function to ask the program to count each response for me and to keep this count up to date when new entries come in.
So, let’s assume I want each of my new tables to count the number of responses recorded for each category of interest. (For example, in the “Which media do you use?” table, I want the “Totals” cell in the row marked “pencil” to log how many people said they use a pencil to write in books.)
To make this possible, I’ll add a function string in each cell within the “totals” row. The textbox below includes the basic function I’m using for this. I’ve added the placeholders “Starting Cell: Ending Cell” and “[Category to count]” so you can adapt them to your own purposes.
=COUNTIF([Starting Cell]:[Ending Cell], CONCATENATE(“*”, “[Category to count]“, “*”))
Here’s what this looks like in practice:
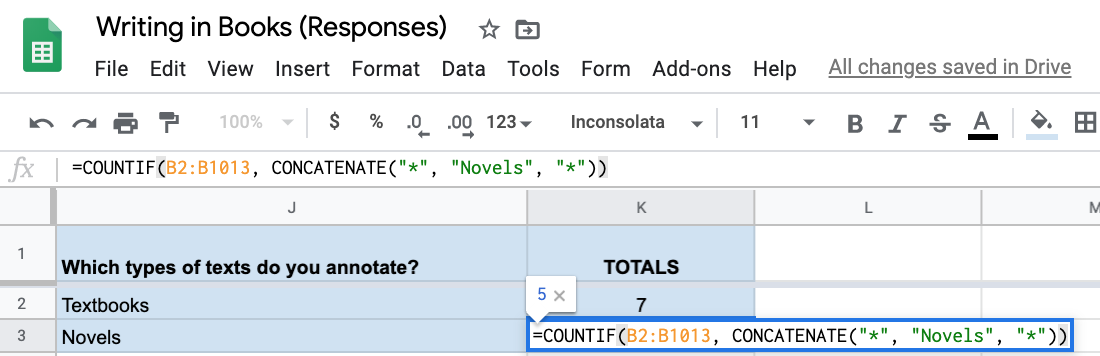
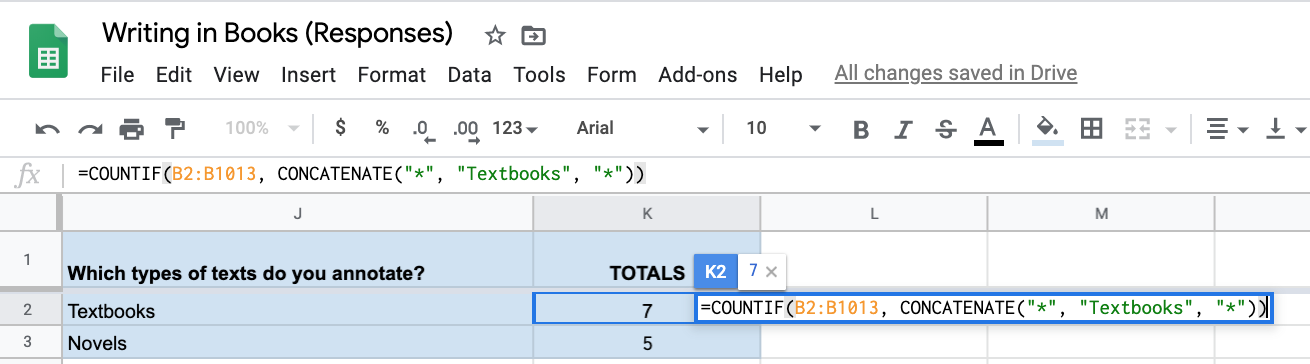
An explanation of the starting/ending cells in this example–(B2:B1013)
In my worksheet example, the information I want to record is being put into Column B.
As my “Starting Cell,” I’ll use the first cell where my information is being recorded. (In this case, B2). As my “Ending Cell,” I’ll pick a cell far down the very same column. In this example, I’ve chosen to use cell B1013. (This is a pretty arbitrary number in this case. I simply picked a number that seemed improbably high. I’d be delighted if 1,013 people responded to this survey, but it’d probably take a long time for this to happen, so it’s a safe bet to use that as the cell where Google will stop counting up responses.)
Step 2.3: Use Table Data To Create Chart Displays
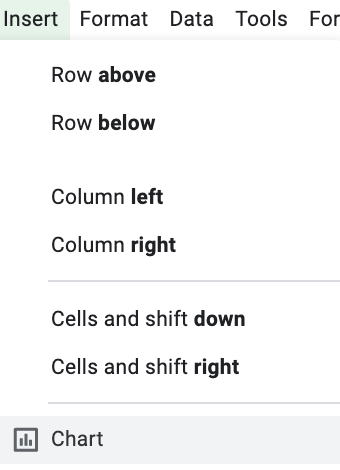
Click “Insert” > “Chart” and use each separate table as the basis for a display.
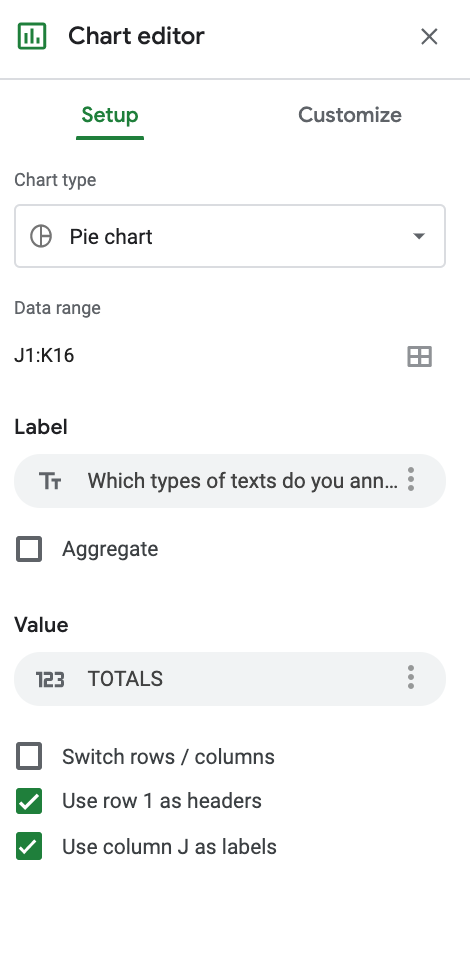
You can customize what kind of chart you want to have and what should count as headers, labels, etc.
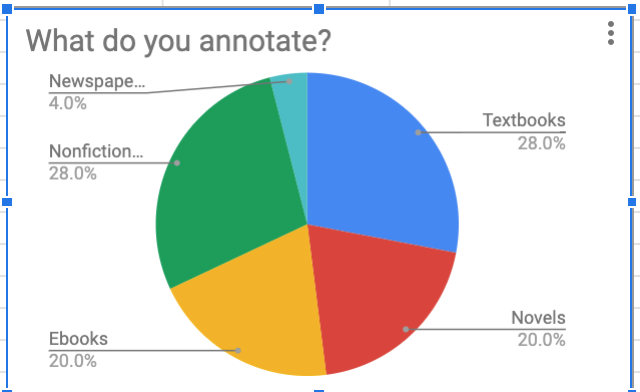
This is an example of the resulting chart:
Part 3: Embed Poll Displays Into H5P Activities
Step 3.1: To display a version of this chart that will live-update in your book, you’ll want to start by copying the Google Forms link to the responsive version of your chart.
To find this link, click on the three-dot menu icon at the corner of your chart.
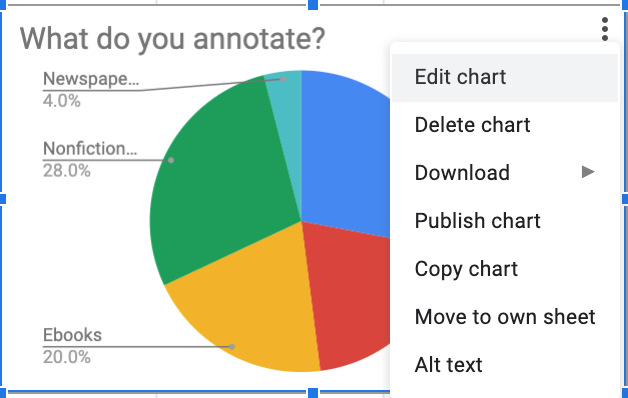
Next, click on the “Publish Chart” dropdown option.
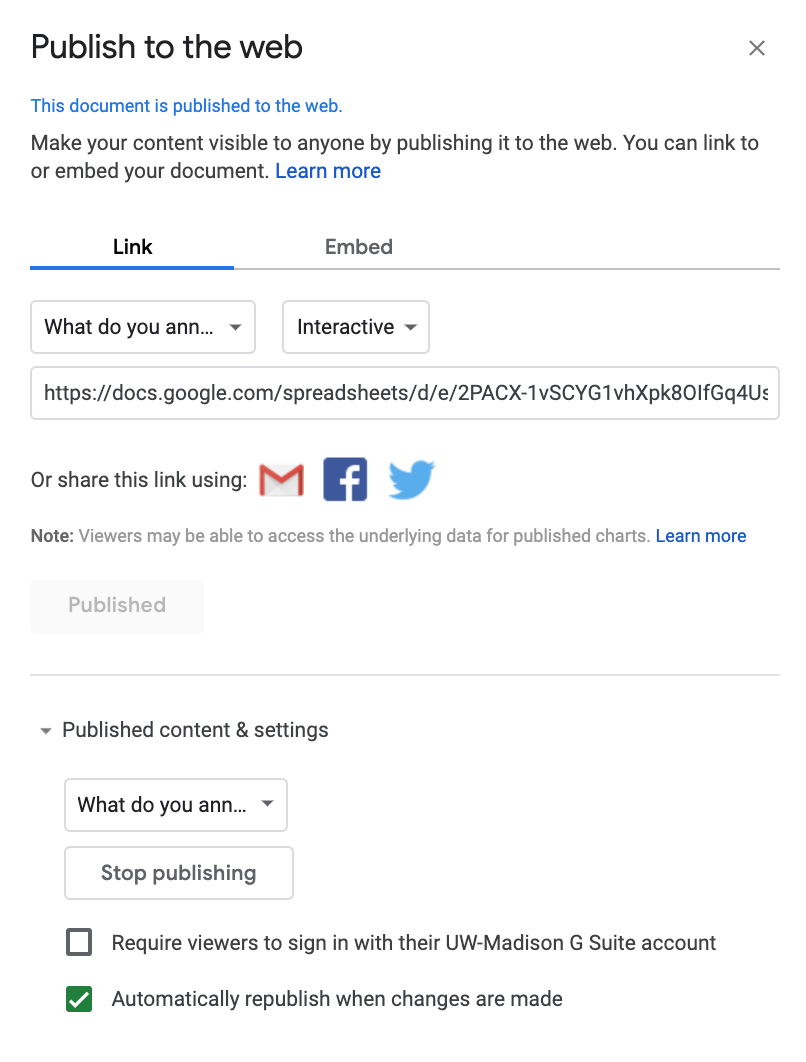
You’ll see a screen that allows you to choose how your link will act when users click on it. I like to make sure that my own charts are labeled “interactive” (to display additional information on mouseover) and to check the box marked “Automatically republish when changes are made.” Copy the resulting link.
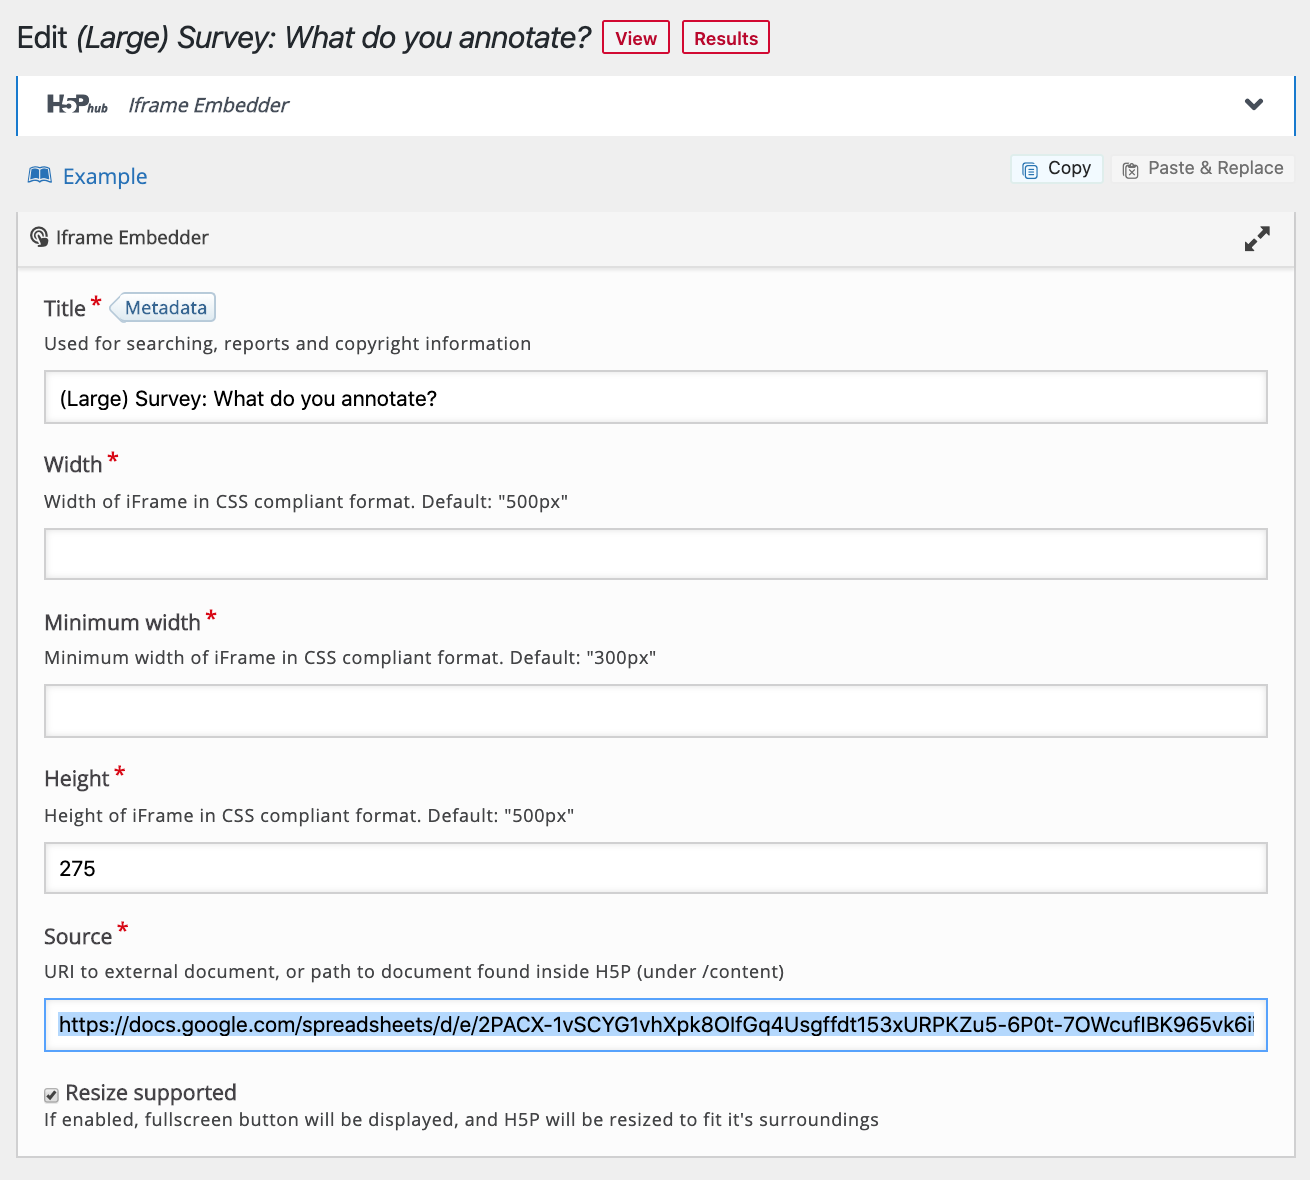
Step 3.2: Create an H5P Iframe Embedder activity and add the link you’ve copied to the “Source” textbox.
Step 3.3: Add your H5P activity to your text.
Here’s an example of what we just made:
- In the example spreadsheet provided, you'll see duplicate tables and chart displays. There are duplicate displays in this example because we were creating chart outputs of two different sizes--one for the annotation layer and one for the larger display. Unfortunately, Google doesn't let you send information from one table to two different charts. ↵
