2 Plate Tectonics
KEY CONCEPTS
At the end of this chapter, students should be able to:
- Describe how the ideas behind plate tectonics started with Alfred Wegener’s hypothesis of continental drift
- Describe the physical and chemical layers of the Earth and how they affect plate movement
- Explain how movement at the three types of plate boundaries causes earthquakes, volcanoes, and mountain building
- Identify convergent boundaries, including subduction and collisions, as places where plates come together
- Identify divergent boundaries, including rifts and mid-ocean ridges, as places where plates separate
- Explain transform boundaries as places where adjacent plates shear past each other
- Describe the Wilson Cycle, beginning with continental rifting, ocean basin creation, plate subduction, and ending with ocean basin closure
- Explain how the tracks of hotspots, places that have continually rising magma, is used to calculate plate motion
Revolution is a word usually reserved for significant political or social changes. Several of these idea revolutions forced scientists to re-examine their entire field, triggering a paradigm shift that shook up their conventionally held knowledge. Charles Darwin’s book on evolution, On the Origin of Species, published in 1859; Gregor Mendel’s discovery of the genetic principles of inheritance in 1866; and James Watson, Francis Crick, and Rosalind Franklin’s model for the structure of DNA in 1953 did that for biology. Albert Einstein’s relativity and quantum mechanics concepts in the early twentieth century did the same for Newtonian physics.
The concept of plate tectonics was just as revolutionary for geology. The theory of plate tectonics attributes the movement of massive sections of the Earth’s outer layers with creating earthquakes, mountains, and volcanoes. Many earth processes make more sense when viewed through the lens of plate tectonics. Because it is so important in understanding how the world works, plate tectonics is the first topic of discussion in this textbook.
2.1 Alfred Wegener’s Continental Drift Hypothesis

Alfred Wegener (1880-1930) was a German scientist who specialized in meteorology and climatology. His knack for questioning accepted ideas started in 1910 when he disagreed with the explanation that the Bering Land Bridge was formed by isostasy, and that similar land bridges once connected the continents. After reviewing the scientific literature, he published a hypothesis stating the continents were originally connected, and then drifted apart. While he did not have the precise mechanism worked out, his hypothesis was backed up by a long list of evidence.
2.1.1 Early Evidence for Continental Drift Hypothesis
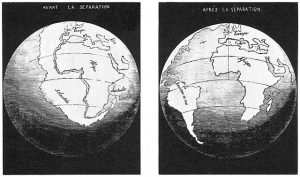
Wegener’s first piece of evidence was that the coastlines of some continents fit together like pieces of a jigsaw puzzle. People noticed the similarities in the coastlines of South America and Africa on the first world maps, and some suggested the continents had been ripped apart. Antonio Snider-Pellegrini did preliminary work on continental separation and matching fossils in 1858.
What Wegener did differently was synthesize a large amount of data in one place. He used true edges of the continents, based on the shapes of the continental shelves. This resulted in a better fit than previous efforts that traced the existing coastlines.
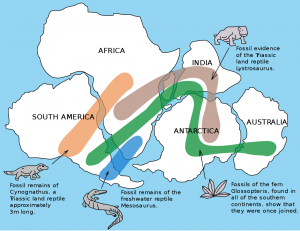
Wegener also compiled evidence by comparing similar rocks, mountains, fossils, and glacial formations across oceans. For example, the fossils of the primitive aquatic reptile Mesosaurus were found on the separate coastlines of Africa and South America. Fossils of another reptile, Lystrosaurus, were found on Africa, India, and Antarctica. He pointed out these were land-dwelling creatures could not have swum across an entire ocean.
Opponents of continental drift insisted trans-oceanic land bridges allowed animals and plants to move between continents. The land bridges eventually eroded away, leaving the continents permanently separated. The problem with this hypothesis is the improbability of a land bridge being tall and long enough to stretch across a broad, deep ocean.
More support for continental drift came from the puzzling evidence that glaciers once existed in normally very warm areas in southern Africa, India, Australia, and Arabia. These climate anomalies could not be explained by land bridges. Wegener found similar evidence when he discovered tropical plant fossils in the frozen region of the Arctic Circle. As Wegener collected more data, he realized the explanation that best fit all the climate, rock, and fossil observations involved moving continents.
2.1.2 Proposed Mechanism for Continental Drift
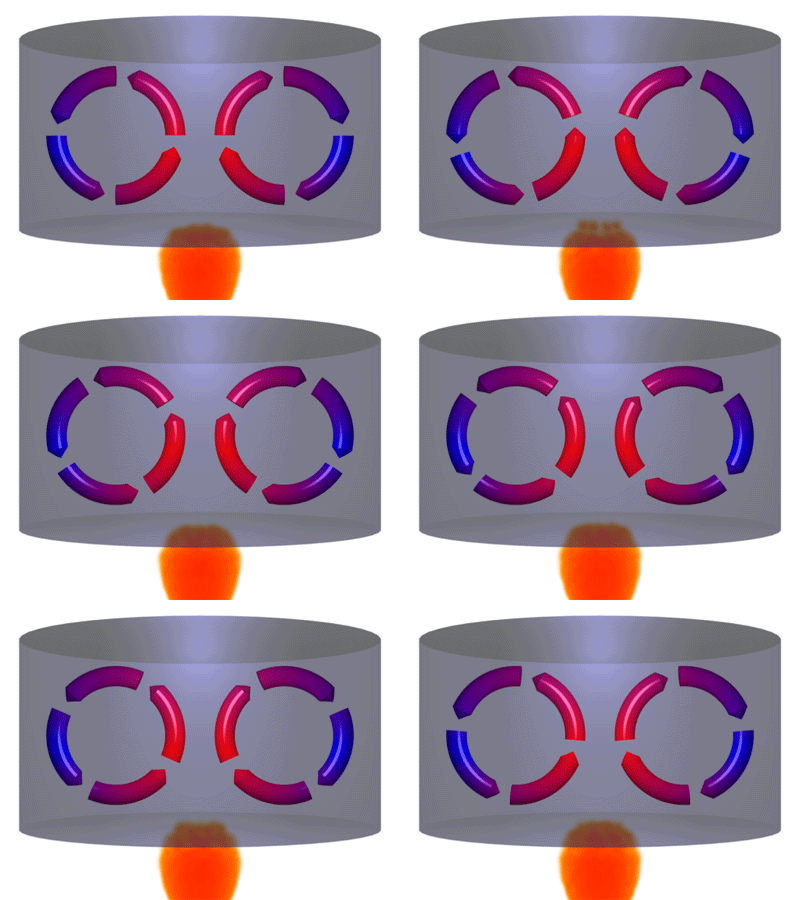
Wegener’s work was considered a fringe science theory for his entire life. One of the biggest flaws in his hypothesis was an inability to provide a mechanism for how the continents moved. Obviously, the continents did not appear to move, and changing the conservative minds of the scientific community would require exceptional evidence that supported a credible mechanism. Other pro-continental drift followers used expansion, contraction, or even the moon’s origin to explain how the continents moved. Wegener used centrifugal forces and precession, but this model was proven wrong. He also speculated about seafloor spreading, with hints of convection, but could not substantiate these proposals. As it turns out, current scientific knowledge reveals convection is one the major forces in driving plate movements, along with gravity and density.
2.1.3 Development of Plate Tectonic Theory
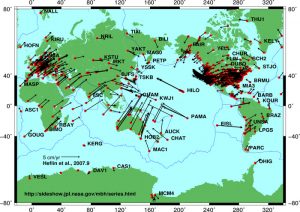
Wegener died in 1930 on an expedition in Greenland. Poorly respected in his lifetime, Wegener and his ideas about moving continents seemed destined to be lost in history as fringe science. However, in the 1950s, evidence started to trickle in that made continental drift a more viable idea. By the 1960s, scientists had amassed enough evidence to support the missing mechanism—namely, seafloor spreading—for Wegener’s hypothesis of continental drift to be accepted as the theory of plate tectonics. Ongoing GPS and earthquake data analyses continue to support this theory. The next section provides the pieces of evidence that helped transform one man’s wild notion into a scientific theory.
Mapping of the Ocean Floors
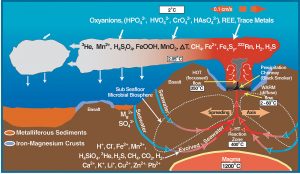
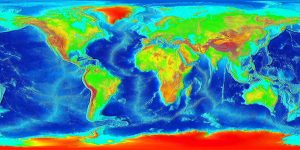
In 1947 researchers started using an adaptation of SONAR to map a region in the middle of the Atlantic Ocean with poorly-understood topographic and thermal properties. Using this information, Bruce Heezen and Marie Tharp created the first detailed map of the ocean floor to reveal the Mid-Atlantic Ridge, a basaltic mountain range that spanned the length of the Atlantic Ocean, with rock chemistry and dimensions unlike the mountains found on the continents. Initially scientists thought the ridge was part of a mechanism that explained the expanding Earth or ocean-basin growth hypotheses. In 1959, Harry Hess proposed the hypothesis of seafloor spreading – that the mid-ocean ridges represented tectonic plate factories, where new oceanic plate was issuing from these long volcanic ridges. Scientists later included transform faults perpendicular to the ridges to better account for varying rates of movement between the newly formed plates. When earthquake epicenters were discovered along the ridges, the idea that earthquakes were linked to plate movement took hold.

Seafloor sediment, measured by dredging and drilling, provided another clue. Scientists once believed sediment accumulated on the ocean floors over a very long time in a static environment. When some studies showed less sediment than expected, these results were initially used to argue against continental movement. With more time, researchers discovered these thinner sediment layers were located close to mid-ocean ridges, indicating the ridges were younger than the surrounding ocean floor. This finding supported the idea that the sea floor was not fixed in one place.
Paleomagnetism
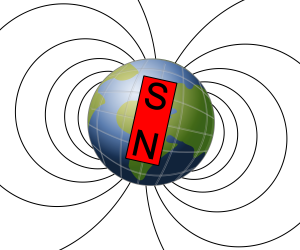
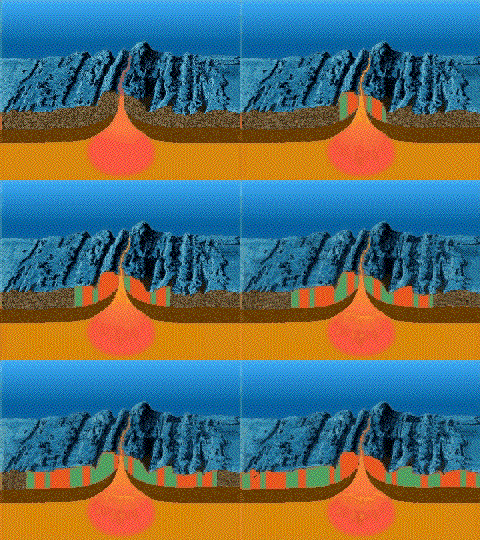
The seafloor was also mapped magnetically. Scientists had long known of strange magnetic anomalies that formed a striped pattern of symmetrical rows on both sides of mid-oceanic ridges. What made these features unusual was the north and south magnetic poles within each stripe was reversed in alternating rows. By 1963, Harry Hess and other scientists used these magnetic reversal patterns to support their model for seafloor spreading (see also Lawrence W. Morley).
Paleomagnetism is the study of magnetic fields frozen within rocks, basically a fossilized compass. In fact, the first hard evidence to support plate motion came from paleomagnetism.
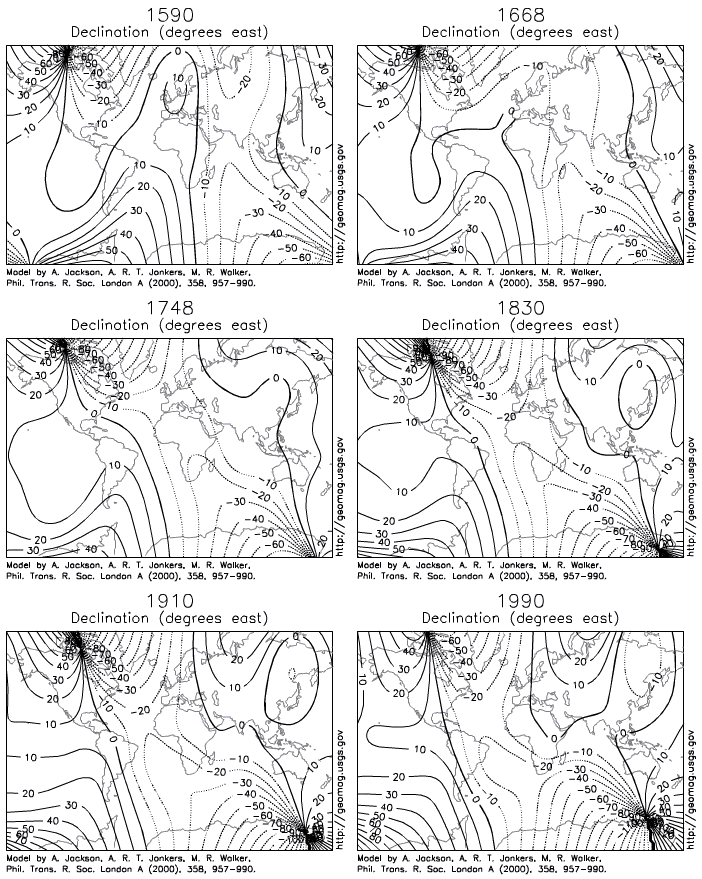
Igneous rocks containing magnetic minerals like magnetite typically provide the most useful data. In their liquid state as magma or lava, the magnetic poles of the minerals align themselves with the Earth’s magnetic field. When the rock cools and solidifies, this alignment is frozen into place, creating a permanent paleomagnetic record that includes magnetic inclination related to global latitude, and declination related to magnetic north.
Scientists had noticed for some time the alignment of magnetic north in many rocks was nowhere close to the earth’s current magnetic north. Some explained this away are part of the normal movement of earth’s magnetic north pole. Eventually, scientists realized adding the idea of continental movement explained the data better than pole movement alone.
Wadati-Benioff Zones
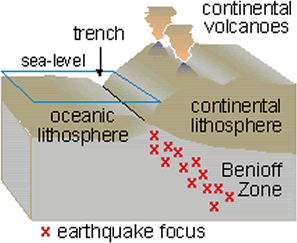
Around the same time mid-ocean ridges were being investigated, other scientists linked the creation of ocean trenches and island arcs to seismic activity and tectonic plate movement. Several independent research groups recognized earthquake epicenters traced the shapes of oceanic plates sinking into the mantle. These deep earthquake zones congregated in planes that started near the surface around ocean trenches and angled beneath the continents and island arcs. Today these earthquake zones called Wadati-Benioff zones.

Based on the mounting evidence, the theory plate tectonics continued to take shape. J. Tuzo Wilson was the first scientist to put the entire picture together by proposing that the opening and closing of the ocean basins. Before long, scientists proposed other models showing plates moving with respect to each other, with clear boundaries between them. Others started piecing together complicated histories of tectonic plate movement. The plate tectonic revolution had taken hold.

Take this quiz to check your comprehension of this section.

2.2 Layers of the Earth
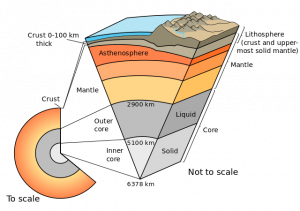
In order to understand the details of plate tectonics, it is essential to first understand the layers of the earth. Firsthand information about what is below the surface is very limited; most of what we know is pieced together from hypothetical models, and analyzing seismic wave data and meteorite materials. In general, the Earth can be divided into layers based on chemical composition and physical characteristics.
2.2.1 Chemical Layers
Certainly the earth is composed of a countless combination of elements. Regardless of what elements are involved two major factors—temperature and pressure—are responsible for creating three distinct chemical layers.
Crust
The outermost chemical layer and the one we currently reside on, is the crust. There are two types of crust. Continental crust has a relatively low density and composition similar to granite. Oceanic crust has a relatively high density, especially when cold and old, and composition similar to basalt. The surface levels of crust are relatively brittle. The deeper parts of the crust are subjected to higher temperatures and pressure, which makes them more ductile. Ductile materials are like soft plastics or putty, they move under force. Brittle materials are like solid glass or pottery, they break under force, especially when it is applied quickly. Earthquakes, generally occur in the upper crust and are caused by the rapid movement of relatively brittle materials.
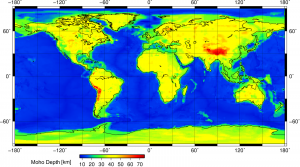
The base of the crust is characterized by a large increase in seismic velocity, which measures how fast earthquake waves travel through solid matter. Called the Mohorovičić Discontinuity, or Moho for short, this zone was discovered by Andrija Mohorovičić (pronounced mo-ho-ro-vee-cheech; audio pronunciation) in 1909 after studying earthquake wave paths in his native Croatia. The change in wave direction and speed is caused by dramatic chemical differences of the crust and mantle. Underneath the oceans, the Moho is found roughly 5 km below the ocean floor. Under the continents, it is located about 30-40 km below the surface. Near certain large mountain-building events known as orogenies, the continental Moho depth is doubled.
Mantle
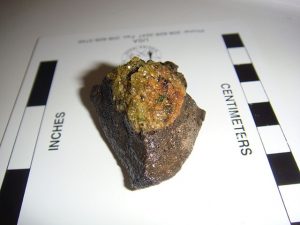
The mantle sits below the crust and above the core. It is the largest chemical layer by volume, extending from the base of the crust to a depth of about 2900 km. Most of what we know about the mantle comes from seismic wave analysis, though information is gathered by studying ophiolites and xenoliths. Ophiolites are pieces of mantle that have risen through the crust until they are exposed as part of the ocean floor. Xenoliths are carried within magma and brought to the Earth’s surface by volcanic eruptions. Most xenoliths are made of peridotite, an ultramafic class of igneous rock (see chapter 4.2 for explanation). Because of this, scientists hypothesize most of the mantle is made of peridotite.
Core
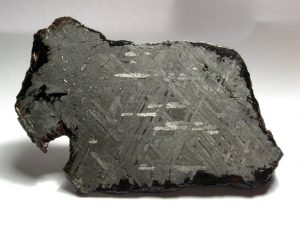
The core of the Earth, which has both liquid and solid layers, and consists mostly of iron, nickel, and possibly some oxygen. Scientists looking at seismic data first discovered this innermost chemical layer in 1906. Through a union of hypothetical modeling, astronomical insight, and hard seismic data, they concluded the core is mostly metallic iron. Scientists studying meteorites, which typically contain more iron than surface rocks, have proposed the earth was formed from meteoric material. They believe the liquid component of the core was created as the iron and nickel sank into the center of the planet, where it was liquefied by intense pressure.
2.2.2 Physical Layers
The Earth can also be broken down into five distinct physical layers based on how each layer responds to stress. While there is some overlap in the chemical and physical designations of layers, specifically the core–mantle boundary, there are significant differences between the two systems.
Lithosphere
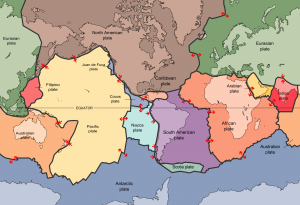
Lithos is Greek for stone, and the lithosphere is the outermost physical layer of the Earth. It is grouped into two types: oceanic and continental. Oceanic lithosphere is thin and relatively rigid. It ranges in thickness from nearly zero in new plates found around mid-ocean ridges, to an average of 140 km in most other locations. Continental lithosphere is generally thicker and considerably more plastic, especially at the deeper levels. Its thickness ranges from 40 to 280 km. The lithosphere is not continuous. It is broken into segments called plates. A plate boundary is where two plates meet and move relative to each other. Plate boundaries are where we see plate tectonics in action—mountain building, triggering earthquakes, and generating volcanic activity.
Asthenosphere
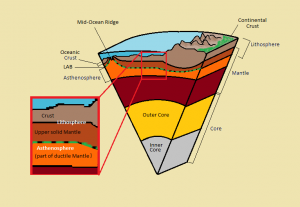
The asthenosphere is the layer below the lithosphere. Astheno- means lacking strength, and the most distinctive property of the asthenosphere is movement. Because it is mechanically weak, this layer moves and flows due to convection currents created by heat coming from the earth’s core cause. Unlike the lithosphere that consists of multiple plates, the asthenosphere is relatively unbroken. Scientists have determined this by analyzing seismic waves that pass through the layer. The depth of at which the asthenosphere is found is temperature-dependent. It tends to lie closer to the earth’s surface around mid-ocean ridges and much deeper underneath mountains and the centers of lithospheric plates.
Mesosphere
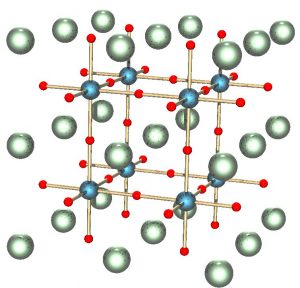
Bridgmenite,
(Mg,Fe)SiO3) are thought to be the main component of the lower mantle, making it the most common mineral in or on Earth.
The mesosphere, sometimes known as the lower mantle, is more rigid and immobile than the asthenosphere. Located at a depth of approximately 410 and 660 km below the earth’s surface, the mesosphere is subjected to very high pressures and temperatures. These extreme conditions create a transition zone in the upper mesosphere where minerals continuously change into various forms, or pseudomorphs. Scientists identify this zone by changes in seismic velocity and sometimes physical barriers to movement. Below this transitional zone, the mesosphere is relatively uniform until it reaches the core.
Inner and Outer Core

The outer core is the only entirely liquid layer within the Earth. It starts at a depth of 2,890 km and extends to 5,150 km, making it about 2,300 km thick. In 1936, the Danish geophysicist Inge Lehmann analyzed seismic data and was the first to prove a solid inner core existed within a liquid outer core . The solid inner core is about 1,220 km thick, and the outer core is about 2,300 km thick.
It seems like a contradiction that the hottest part of the Earth is solid, as the minerals making up the core should be liquified or vaporized at this temperature. Immense pressure keeps the minerals of the inner core in a solid phase. The inner core grows slowly from the lower outer core solidifying as heat escapes the interior of the Earth and is dispersed to the outer layers.
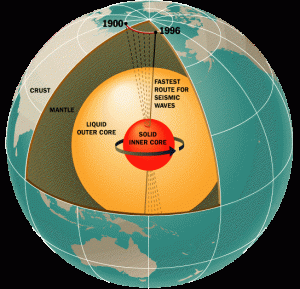
The earth’s liquid outer core is critically important in maintaining a breathable atmosphere and other environmental conditions favorable for life. Scientists believe the earth’s magnetic field is generated by the circulation of molten iron and nickel within the outer core. If the outer core were to stop circulating or become solid, the loss of the magnetic field would result in Earth getting stripped of life-supporting gases and water. This is what happened, and continues to happen, on Mars.

2.2.3 Plate Tectonic Boundaries
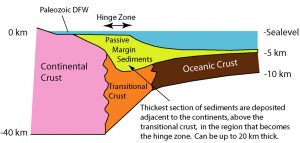
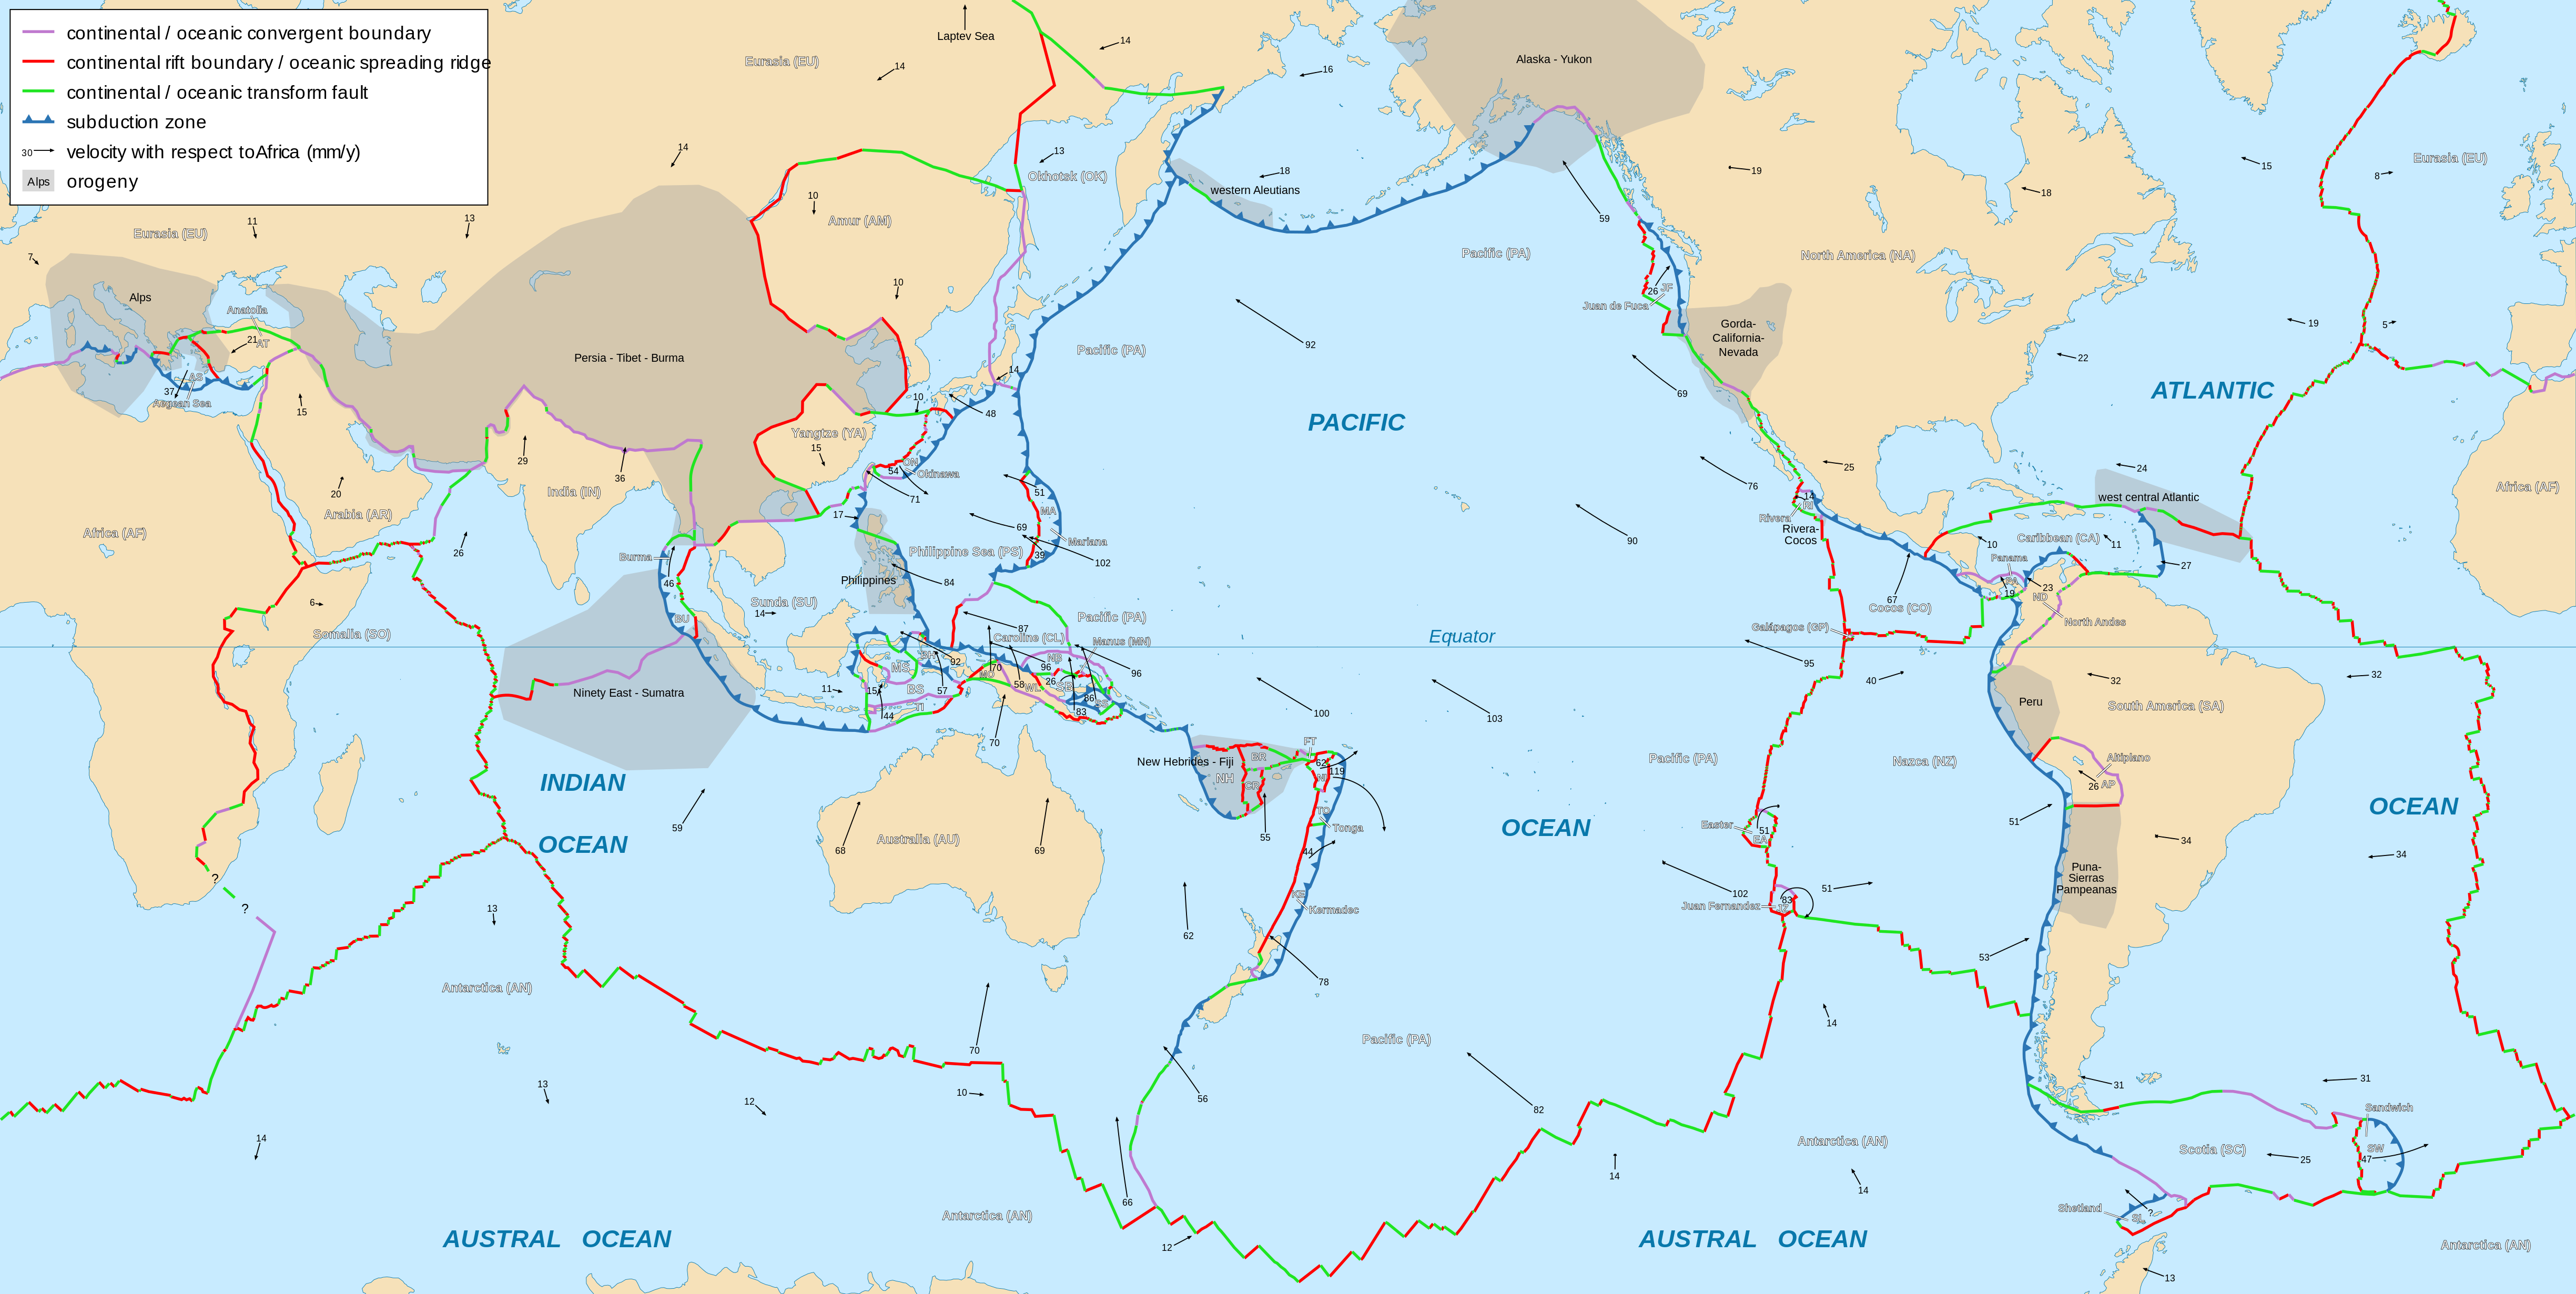
At passive margins the plates don’t move—the continental lithosphere transitions into oceanic lithosphere and forms plates made of both types. A tectonic plate may be made of both oceanic and continental lithosphere connected by a passive margin. North and South America’s eastern coastlines are examples of passive margins. Active margins are places where the oceanic and continental lithospheric tectonic plates meet and move relative to each other, such as the western coasts of North and South America. This movement is caused by frictional drag created between the plates and differences in plate densities. The majority of mountain-building events, earthquake activity and active volcanism on the Earth’s surface can be attributed to tectonic plate movement at active margins.
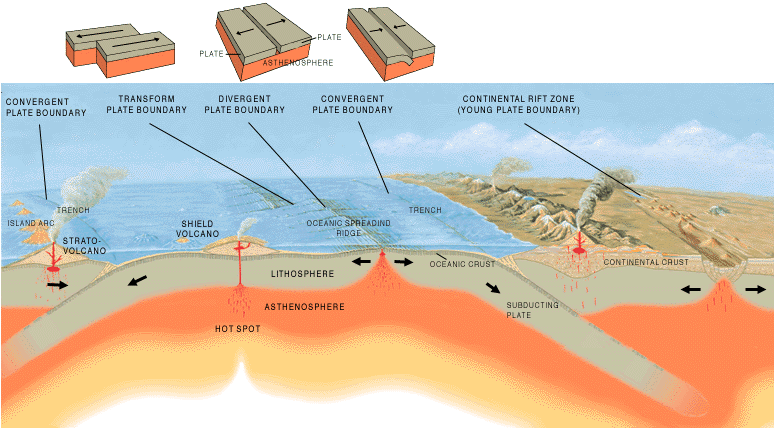
In a simplified model, there are three categories of tectonic plate boundaries. Convergent boundaries are places where plates move toward each other. At divergent boundaries, the plates move apart. At transform boundaries, the plates slide past each other.
Take this quiz to check your comprehension of this section.

2.3 Convergent Boundaries
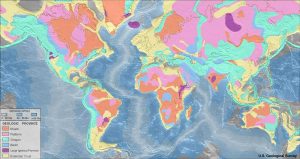
Convergent boundaries, also called destructive boundaries, are places where two or more plates move toward each other. . Convergent boundary movement is divided into two types, subduction and collision, depending on the density of the involved plates. Continental lithosphere is of lower density and thus more buoyant than the underlying asthenosphere. Oceanic lithosphere is more dense than continental lithosphere, and, when old and cold, may even be more dense than asthenosphere.
When plates of different densities converge, the higher density plate is pushed beneath the more buoyant plate in a process called subduction. When continental plates converge without subduction occurring, this process is called collision.
2.3.1. Subduction
Video showing continental–oceanic subduction, causing volcanism. By Tanya Atwater and John Iwerks.

Subduction occurs when a dense oceanic plate meets a more buoyant plate, like a continental plate or warmer/younger oceanic plate, and descends into the mantle. The worldwide average rate of oceanic plate subduction is 25 miles per million years, about a half-inch per year. As an oceanic plate descends, it pulls the ocean floor down into a trench. These trenches can be more than twice as deep as the average depth of the adjacent ocean basin, which is usually three to four km. The Mariana Trench, for example, approaches a staggering 11 km.
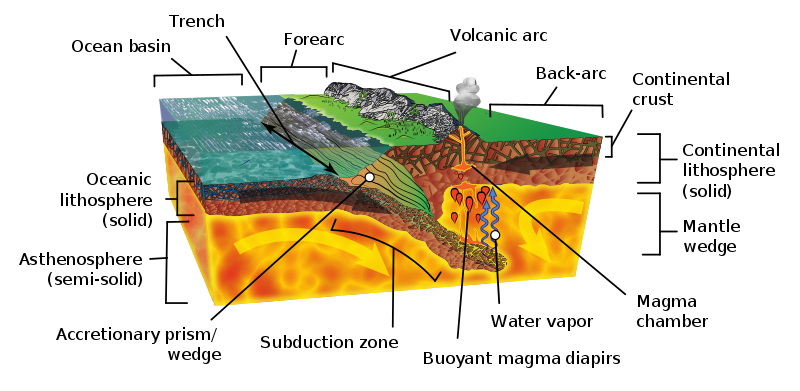
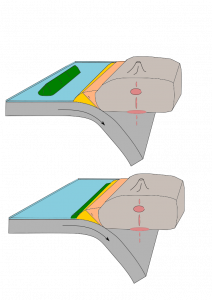
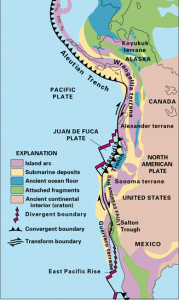
Within the trench, ocean floor sediments are scraped together and compressed between the subducting and overriding plates. This feature is called the accretionary wedge, mélange, or accretionary prism. Fragments of continental material, including microcontinents, riding atop the subducting plate may become sutured to the accretionary wedge and accumulate into a large area of land called a terrane. Vast portions of California are comprised of accreted terranes.
When the subducting oceanic plate, or slab, sinks into the mantle, the immense heat and pressure pushes volatile materials like water and carbon dioxide into an area below the continental plate and above the descending plate called the mantle wedge. The volatiles are released mostly by hydrated minerals that revert to non-hydrated minerals in these higher temperature and pressure conditions. When mixed with asthenospheric material above the plate, the volatile lower the melting point of the mantle wedge, and through a process called flux melting it becomes liquid magma. The molten magma is more buoyant than the lithospheric plate above it and migrates to the Earth’s surface where it emerges as volcanism. The resulting volcanoes frequently appear as curved mountain chains, volcanic arcs, due to the curvature of the earth. Both oceanic and continental plates can contain volcanic arcs.
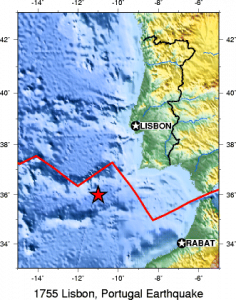
How subduction is initiated is still a matter of scientific debate. It is generally accepted that subduction zones start as passive margins, where oceanic and continental plates come together, and then gravity initiates subduction and converts the passive margin into an active one. One hypothesis is gravity pulls the denser oceanic plate down or the plate can start to flow ductility at a low angle. Scientists seeking to answer this question have collected evidence that suggests a new subduction zone is forming off the coast of Portugal. Some scientists have proposed large earthquakes like the 1755 Lisbon earthquake may even have something to do with this process of creating a subduction zone, although the evidence is not definitive. Another hypothesis proposes subduction happens at transform boundaries involving plates of different densities.
Some plate boundaries look like they should be active, but show no evidence of subduction. The oceanic lithospheric plates on either side of the Atlantic Ocean for example, are denser than the underlying asthenosphere and are not subducting beneath the continental plates. One hypothesis is the bond holding the oceanic and continental plates together is stronger than the downwards force created by the difference in plate densities.
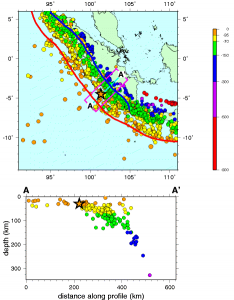
Subduction zones are known for having the largest earthquakes and tsunamis; they are the only places with fault surfaces large enough to create magnitude-9 earthquakes. These subduction-zone earthquakes not only are very large, but also are very deep. When a subducting slab becomes stuck and cannot descend, a massive amount of energy builds up between the stuck plates. If this energy is not gradually dispersed, it may force the plates to suddenly release along several hundred kilometers of the subduction zone. Because subduction-zone faults are located on the ocean floor, this massive amount of movement can generate giant tsunamis such as those that followed the 2004 Indian Ocean Earthquake and 2011 Tōhoku Earthquake in Japan.
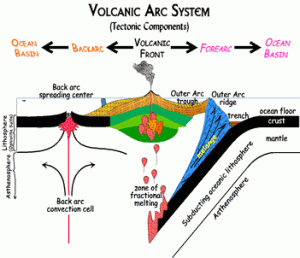
All subduction zones have a forearc basin, a feature of the overriding plate found between the volcanic arc and oceanic trench. The forearc basin experiences a lot of faulting and deformation activity, particularly within the accretionary wedge.
In some subduction zones, tensional forces working on the continental plate create a backarc basin on the interior side of the volcanic arc. Some scientists have proposed a subduction mechanism called oceanic slab rollback creates extension faults in the overriding plates. In this model, the descending oceanic slab does not slide directly under the overriding plate but instead rolls back, pulling the overlying plate seaward. The continental plate behind the volcanic arc gets stretched like pizza dough until the surface cracks and collapses to form a backarc basin. If the extension activity is extensive and deep enough, a backarc basin can develop into a continental rifting zone. These continental divergent boundaries may be less symmetrical than their mid-ocean ridge counterparts.
In places where numerous young buoyant oceanic plates are converging and subducting at a relatively high velocity, they may force the overlying continental plate to buckle and crack. This is called back-arc faulting. Extensional back-arc faults pull rocks and chunks of plates apart. Compressional back-arc faults, also known as thrust faults, push them together.
The dual spines of the Andes Mountain range include a example of compressional thrust faulting. The western spine is part of a volcanic arc. Thrust faults have deformed the non-volcanic eastern spine, pushing rocks and pieces of continental plate on top of each other.
There are two styles of thrust fault deformation: thin-skinned faults that occur in superficial rocks lying on top of the continental plate and thick-skinned faults that reach deeper into the crust. The Sevier Orogeny in the western U.S. is a notable thin-skinned type of deformation created during the Cretaceous Period. The Laramide Orogeny, a thick-skinned type of deformation, occurred near the end of and slightly after the Sevier Orogeny in the same region.
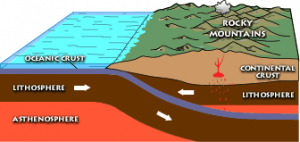
Flat-slab, or shallow, subduction caused the Laramide Orogeny. When the descending slab subducts at a low angle, there is more contact between the slab and the overlying continental plate than in a typical subduction zone. The shallowly-subducting slab pushes against the overriding plate and creates an area of deformation on the overriding plate many kilometers away from the subduction zone.
Oceanic-Continental subduction
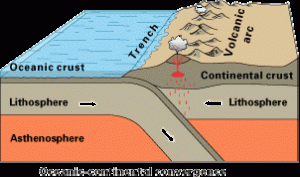
Oceanic-continental subduction occurs when an oceanic plate dives below a continental plate. This convergent boundary has a trench and mantle wedge and frequently, a volcanic arc. Well-known examples of continental volcanic arcs are the Cascade Mountains in the Pacific Northwest and western Andes Mountains in South America.
Oceanic-Oceanic Subduction
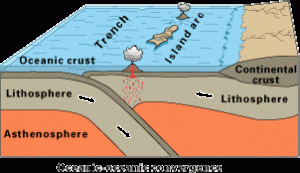
The boundaries of oceanic-oceanic subduction zones show very different activity from those involving oceanic–continental plates. Since both plates are made of oceanic lithosphere, it is usually the older plate that subducts because it is colder and denser. The volcanism on the overlying oceanic plate may remain hidden underwater.. If the volcanoes rise high enough the reach the ocean surface, the chain of volcanism forms an island arc. Examples of these island arcs include the Aleutian Islands in the northern Pacific Ocean, Lesser Antilles in the Caribbean Sea, and numerous island chains scattered throughout the western Pacific Ocean.
2.3.2. Collisions
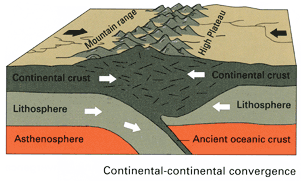
When continental plates converge, during the closing of an ocean basin for example, subduction is not possible between the equally buoyant plates. Instead of one plate descending beneath another, the two masses of continental lithosphere slam together in a process known as collision. Without subduction, there is no magma formation and no volcanism. Collision zones are characterized by tall, non-volcanic mountains; a broad zone of frequent, large earthquakes; and very little volcanism.
When oceanic crust connected by a passive margin to continental crust completely subducts beneath a continent, an ocean basin closes, and continental collision begins. Eventually, as ocean basins close, continents join together to form a massive accumulation of continents called a supercontinent, a process that has taken place in ~500 million year old cycles over earth’s history.
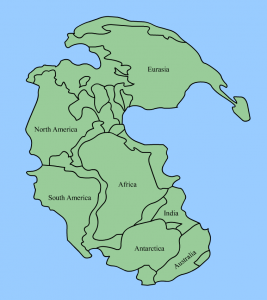
The process of collision created Pangea, the supercontinent envisioned by Wegener as the key component of his continental drift hypothesis. Geologists now have evidence that continental plates have been continuously converging into supercontinents and splitting into smaller basin-separated continents throughout Earth’s existence, calling this process the supercontinent cycle, a process that takes place in approximately 500 million years. For example, they estimate Pangea began separating 200 million years ago. Pangea was preceded by an earlier supercontinents, one of which being Rodinia, which existed 1.1 billion years ago and started breaking apart 800 million to 600 million years ago.
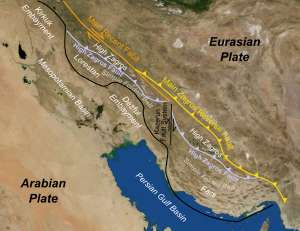
A foreland basin is a feature that develops near mountain belts, as the combined mass of the mountains forms a depression in the lithospheric plate. While foreland basins may occur at subduction zones, they are most commonly found at collision boundaries. The Persian Gulf is possibly the best modern example, created entirely by the weight of the nearby Zagros Mountains.
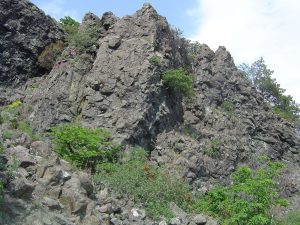
If continental and oceanic lithosphere are fused on the same plate, it can partially subduct but its buoyancy prevents it from fully descending. In very rare cases, part of a continental plate may become trapped beneath a descending oceanic plate in a process called obduction. When a portion of the continental crust is driven down into the subduction zone, due to its buoyancy it returns to the surface relatively quickly.
As pieces of the continental lithosphere break loose and migrate upward through the obduction zone, they bring along bits of the mantle and ocean floor and amend them on top of the continental plate. Rocks composed of this mantle and ocean-floor material are called ophiolites and they provide valuable information about the composition of the mantle.
The area of collision-zone deformation and seismic activity usually covers a broader area because continental lithosphere is plastic and malleable. Unlike subduction-zone earthquakes, which tend to be located along a narrow swath near the convergent boundary, collision-zone earthquakes may occur hundreds of kilometers from the boundary between the plates.
The Eurasian continent has many examples of collision-zone deformations covering vast areas. The Pyrenees mountains begin in the Iberian Peninsula and cross into France. Also, there are the Alps stretching from Italy to central Europe; the Zagros mountains from Arabia to Iran; and Himalaya mountains from the Indian subcontinent to central Asia.
Animation of India crashing into Asia, by Tanya Atwater.

Take this quiz to check your comprehension of this section.

2.4 Divergent Boundaries
At divergent boundaries, sometimes called constructive boundaries, lithospheric plates move away from each other. There are two types of divergent boundaries, categorized by where they occur: continental rift zones and mid-ocean ridges. Continental rift zones occur in weak spots in the continental lithospheric plate. A mid-ocean ridge usually originates in a continental plate as a rift zone that expands to the point of splitting the plate apart, with seawater filling in the gap. The separate pieces continue to drift apart and become individual continents. This process is known as rift-to-drift.
2.4.1. Continental Rifting
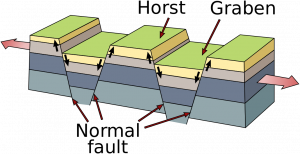
In places where the continental plates are very thick, they reflect so much heat back into the mantle it develops strong convection currents that push super-heated mantle material up against the overlying plate, softening it. Tensional forces created by this convective upwelling begin to pull the weakened plate apart. As it stretches, it becomes thinner and develops deep cracks called extension or normal faults. Eventually plate sections located between large faults drop into deep depressions known as rift valleys, which often contain keystone-shaped blocks of down-dropped crust known as grabens. The shoulders of these grabens are called horsts. If only one side of a section drops, it is called a half-graben. Depending on the conditions, rifts can grow into very large lakes and even oceans.
While seemingly occurring at random, rifting is dictated by two factors. Rifting does not occur in continents with older and more stable interiors, known as cratons. When continental rifting does occur, the break-up pattern resembles the seams of a soccer ball, also called a truncated icosahedron. This is the most common surface-fracture pattern to develop on an evenly expanding sphere because it uses the least amount of energy.
Using the soccer ball model, rifting tends to lengthen and expand along a particular seam while fizzling out in the other directions. These seams with little or no tectonic activity are called failed rift arms. A failed rift arm is still a weak spot in the continental plate; even without the presence of active extension faults, it may develop into a called an aulacogen. One example of a failed rift arm is the Mississippi Valley Embayment, a depression through which the upper end of the Mississippi River flows. Occasionally connected rift arms do develop concurrently, creating multiple boundaries of active rifting. In places where the rift arms do not fail, for example the Afar Triangle, three divergent boundaries can develop near each other forming a triple junction.
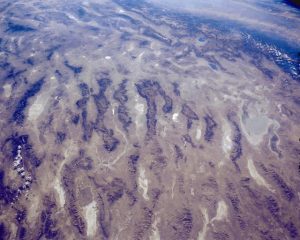
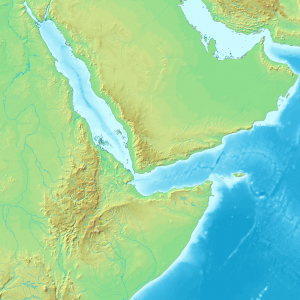
Rifts come in two types: narrow and broad. Narrow rifts are characterized by a high density of highly active divergent boundaries. The East African Rift Zone, where the horn of Africa is pulling away from the mainland, is an excellent example of an active narrow rift. Lake Baikal in Russia is another. Broad rifts also have numerous fault zones, but they are distributed over wide areas of deformation. The Basin and Range region located in the western United States is a type of broad rift. The Wasatch Fault, which also created the Wasatch Mountain Range in the state of Utah, forms the eastern divergent boundary of this broad rift (Animation 1 and Animation 2).
Rifts have earthquakes, although not of the magnitude and frequency of other boundaries. They may also exhibit volcanism. Unlike the flux-melted magma found in subduction zones, rift-zone magma is created by decompression melting. As the continental plates are pulled apart, they create a region of low pressure that melts the lithosphere and draws it upwards. When this molten magma reaches the weakened and fault-riddled rift zone, it migrates to surface by breaking through the plate or escaping via an open fault. Examples of young rift volcanoes dot the Basin and Range region in the United States. Rift-zone activity is responsible for generating some unique volcanism, such as the Ol Doinyo Lengai in Tanzania. This volcano erupts lava consisting largely of carbonatite, a relatively cold, liquid carbonate mineral.
South America and Africa rift, forming the Atlantic. Video by Tanya Atwater.

2.4.2. Mid-ocean ridges
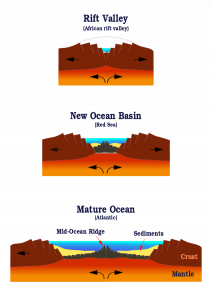
As rifting and volcanic activity progress, the continental lithosphere becomes more mafic (see Chapter 4) and thinner, with the eventual result transforming the plate under the rifting area into oceanic lithosphere. This is the process that gives birth to a new ocean, much like the narrow Red Sea emerged with the movement of Arabia away from Africa. As the oceanic lithosphere continues to diverge, a mid-ocean ridge is formed.
Mid-ocean ridges, also known as spreading centers, have several distinctive features. They are the only places on earth that create new oceanic lithosphere. Decompression melting in the rift zone changes asthenosphere material into new lithosphere, which oozes up through cracks in oceanic plate. The amount of new lithosphere being created at mid-ocean ridges is highly significant. These undersea rift volcanoes produce more lava than all other types of volcanism combined. Despite this, most mid-oceanic ridge volcanism remains unmapped because the volcanoes are located deep on the ocean floor.
In rare cases, such as a few locations in Iceland, rift zones display the type of volcanism, spreading, and ridge formation found on the ocean floor.
The ridge feature is created by the accumulation of hot lithosphere material, which is lighter than the dense underlying asthenosphere. This chunk of isostatically buoyant lithosphere sits partially submerged and partially exposed on the asthenosphere, like an ice cube floating in a glass of water.
As the ridge continues to spread, the lithosphere material is pulled away from the area of volcanism and becomes colder and denser. As it continues to spread and cool, the lithosphere settles into wide swathes of relatively featureless topography called abyssal plains with lower topography.
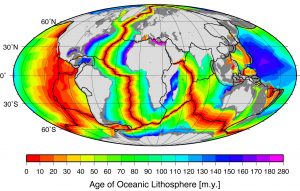
This model of ridge formation suggests the sections of lithosphere furthest away from the mid-ocean ridges will be the oldest. Scientists have tested this idea by comparing the age of rocks located in various locations on the ocean floor. Rocks found near ridges are younger than those found far away from any ridges. Sediment accumulation patterns also confirm the idea of sea-floor spreading. Sediment layers tend to be thinner near mid-ocean ridges, indicating it has had less time to build up.
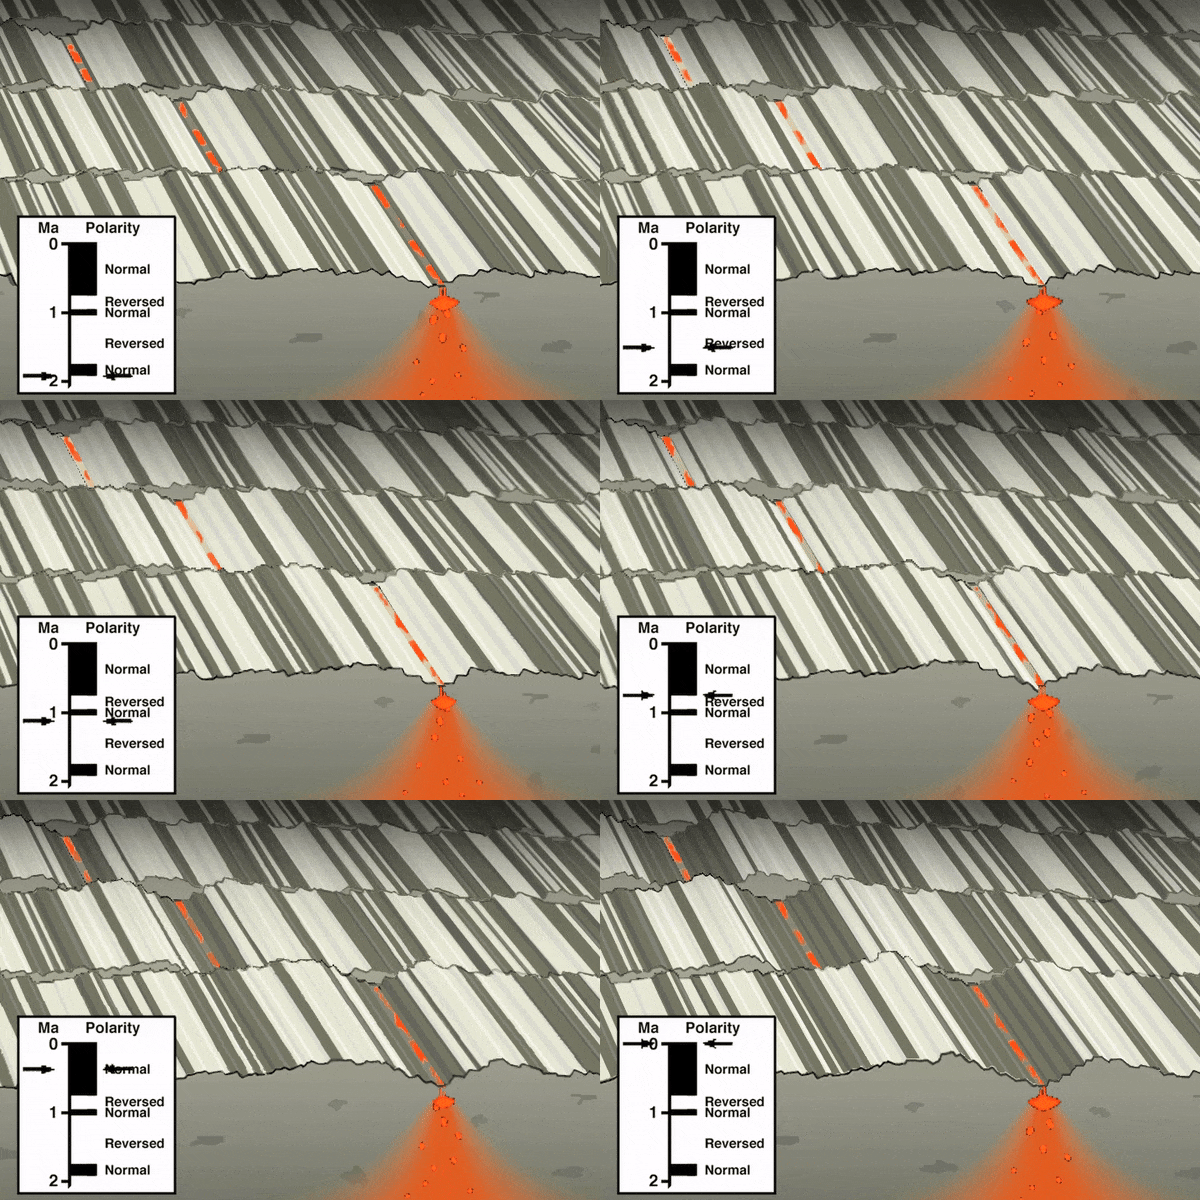

As mentioned in the section on paleomagnetism and the development of plate tectonic theory, scientists noticed mid-ocean ridges contained unique magnetic anomalies that show up as symmetrical striping on both sides of the ridge. The Vine-Matthews-Morley hypothesis proposes these alternating reversals are created by the earth’s magnetic field being imprinted into magma
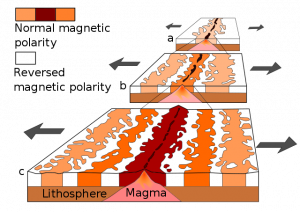
after it emerges from the ridge. Very hot magma has no magnetic field. As the oceanic plates get pulled apart, the magma cools below the Curie point, the temperature below which a magnetic field gets locked into magnetic minerals. The alternating magnetic reversals in the rocks reflects the periodic swapping of earth’s magnetic north and south poles. This paleomagnetic pattern provides a great historical record of ocean-floor movement, and is used to reconstruct past tectonic activity and determine rates of ridge spreading.
Video of the breakup of Pangea and formation of the northern Atlantic Ocean. By Tanya Atwater.

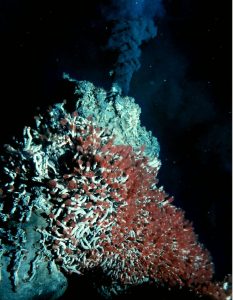
Thanks to their distinctive geology, mid-ocean ridges are home to some of the most unique ecosystems ever discovered. The ridges are often studded with hydrothermal vents, deep fissures that allow seawater to circulate through the upper portions of the oceanic plate and interact with hot rock. The super-heated seawater rises back up to the surface of the plate, carrying dissolved gasses and minerals, and small particulates. The resulting emitted hydrothermal water looks like black underwater smoke.
Scientists had known about these geothermal areas on the ocean floor for some time. However, it was not until 1977, when scientists piloting a deep submergence vehicle, the Alvin, discovered a thriving community of organisms clustered around these hydrothermal vents. These unique organisms, which include 10-foot-long tube worms taller than people, live in the complete darkness of the ocean floor deprived of oxygen and sunlight. They use geothermal energy provided by the vents and a process called bacterial chemosynthesis to feed on sulfur compounds. Before this discovery, scientists believed life on earth could not exist without photosynthesis, a process that requires sunlight. Some scientists suggest this type of environment could have been the origin of life on Earth, and perhaps even extraterrestrial life elsewhere in the galaxy, such as on Jupiter’s moon Europa.
Take this quiz to check your comprehension of this section.

2.5 Transform Boundaries

A transform boundary, sometimes called a strike-slip or conservative boundary, is where the lithospheric plates slide past each other in the horizontal plane. This movement is described based on the perspective of an observer standing on one of the plates, looking across the boundary at the opposing plate. Dextral, also known as right-lateral, movement describes the opposing plate moving to the right. Sinistral, also known as left lateral, movement describe the opposing plate moving to the left.
Most transform boundaries are found on the ocean floor, around mid-ocean ridges. These boundaries form aseismic fracture zones, filled with earthquake-free transform faults, to accommodate different rates of spreading occurring at the ridge.
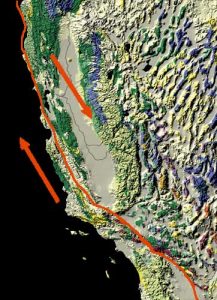
Some transform boundaries produce significant seismic activity, primarily as earthquakes, with very little mountain-building or volcanism. This type of transform boundary may contain a single fault or series of faults, which develop in places where plate tectonic stresses are transferred to the surface. As with other types of active boundaries, if the plates are unable to shear past each other the tectonic forces will continue to build up. If the built up energy between the plates is suddenly released, the result is an earthquake.
In the eyes of humanity, the most significant transform faults occur within continental plates, and have a shearing motion that frequently produces moderate-to-large magnitude earthquakes. Notable examples include the San Andreas Fault in California, Northern and Eastern Anatolian Faults in Turkey, Altyn Tagh Fault in central Asia, and Alpine Fault in New Zealand.
2.5.1. Transpression and Transtension
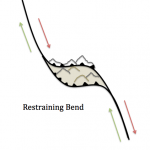
Bends along transform faults may create compressional or extensional forces that cause secondary faulting zones. Transpression occurs where there is a component of compression in addition to the shearing motion. These forces build up around the area of the bend, where the opposing plates are restricted from sliding past each other. As the forces continue to build up, they create mountains in the restraining bend around the fault. The Big Bend area, located in the southern part of the San Andreas Fault includes a large area of transpression where many mountains have been built, moved, and even rotated.
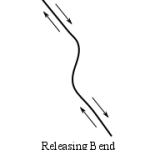
Transtension zones require a fault that includes a releasing bend, where the plates are being pulled apart by extensional forces. Depressions and sometimes volcanism develop in the releasing bend, along the fault. The Dead Sea found between Israel and Jordan, and the Salton Sea of California are examples of basins formed by transtensional forces.
2.5.2. Piercing Points
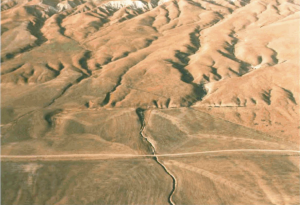
When a geological feature is cut by a fault, it is called a piercing point. Piercing points are very useful for recreating past fault movement, especially along transform boundaries. Transform faults are unique because their horizontal motion keeps a geological feature relatively intact, preserving the record of what happened. Other types of faults—normal and reverse —tend to be more destructive, obscuring or destroying these features. The best type of piercing point includes unique patterns that are used to match the parts of a geological feature separated by fault movement. Detailed studies of piercing points show the San Andreas Fault has experienced over 225 km of movement in the last 20 million years, and this movement occurred at three different fault traces.
Video of the origin of the San Andreas fault. As the mid-ocean ridge subducts, the relative motion between the remaining plates become transform, forming the fault system. Note that because the motion of the plates is not exactly parallel to the fault, it causes divergent motion in the interior of North America. By Tanya Atwater.

Take this quiz to check your comprehension of this section.

2.6 The Wilson Cycle
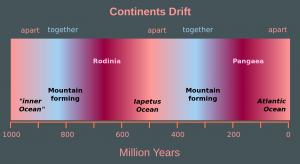
The Wilson Cycle is named for J. Tuzo Wilson who first described it in 1966, and it outlines the ongoing origin and breakup of supercontinents, such as Pangea and Rodinia. Scientists have determined this cycle has been operating for at least three billion years and possibly earlier.
There are a number of hypotheses about how the Wilson Cycle works. One mechanism proposes that rifting happens because continental plates reflect the heat much better than oceanic plates. When continents congregate together, they reflect more of the Earth’s heat back into the mantle, generating more vigorous convection currents that then start the continental rifting process. Some geologists believe mantle plumes are remnants of these periods of increased mantle temperature and convection upwelling, and study them for clues about the origin of continental rifting.
The mechanism behind how supercontinents are created is still largely a mystery. There are three schools of thought about what continues to drive the continents further apart and eventually bring them together. The ridge-push hypothesis suggests after the initial rifting event, plates continue to be pushed apart by mid-ocean spreading centers and their underlying convection currents. Slab-pull proposes the plates are pulled apart by descending slabs in the subduction zones of the oceanic–continental margins. A third idea, gravitational sliding, attributes the movement to gravitational forces pulling the lithospheric plates down from the elevated mid-ocean ridges and across the underlying asthenosphere. Current evidence seems to support slab pull more than ridge push or gravitational sliding.
2.7 Hotspots
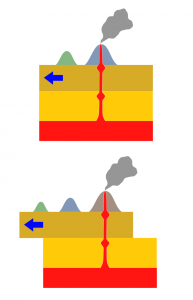
The Wilson Cycle provides a broad overview of tectonic plate movement. To analyze plate movement more precisely, scientists study hotspots. First postulated by J. Tuzo Wilson in 1963, a hotspot is an area in the lithospheric plate where molten magma breaks through and creates a volcanic center, islands in the ocean and mountains on land. As the plate moves across the hotspot, the volcano center becomes extinct because it is no longer over an active magma source. Instead, the magma emerges through another area in the plate to create a new active volcano. Over time, the combination of moving plate and stationary hotspot creates a chain of islands or mountains. The classic definition of hotspots states they do not move, although recent evidence suggests that there may be exceptions.
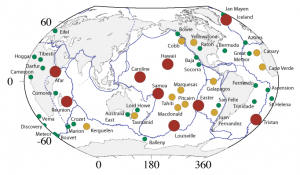
Hotspots are the only types of volcanism not associated with subduction or rifting zones at plate boundaries; they seem totally disconnected from any plate tectonics processes, such as earthquakes. However, there are relationships between hotspots and plate tectonics. There are several hotspots, current and former, that are believed to have begun at the time of rifting. Also, scientists use the age of volcanic eruptions and shape of the chain to quantify the rate and direction of plate movement relative to the hotspot.
Scientists are divided over how magma is generated in hotspots. Some suggest that hotspots originate from super-heated material from as deep as the core that reaches the Earth’s crust as a mantle plume. Others argue the molten material that feeds hotspots is sourced from the mantle. Of course, it is difficult to collect data from these deep-Earth features due to the extremely high pressure and temperature.
How hotspots are initiated is another highly debated subject. The prevailing mechanism has hotspots starting in divergent boundaries during supercontinent rifting. Scientists have identified a number of current and past hotspots believed to have begun this way. Subducting slabs have also been named as causing mantle plumes and hot-spot volcanism. Some geologists have suggested another geological process not involving plate tectonics may be involved, such as a large space objects crashing into Earth. Regardless of how they are formed, dozens are on the Earth. Some well-known examples include the Tahiti Islands, Afar Triangle, Easter Island, Iceland, Galapagos Islands, and Samoan Islands. The United States is home to two of the largest and best-studied hotspots: Hawaii and Yellowstone.
2.7.1 Hawaiian hotspot
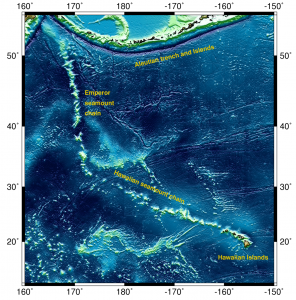
The active volcanoes in Hawaii represent one of the most active hotspot sites on earth. Scientific evidence indicates the Hawaiian hotspot is at least 80 million years old. Geologists believe it is actually much older; however any rocks with proof of this have been subducted under the ocean floor. The big island of Hawaii sits atop a large mantle plume that marks the active hotspot. The Kilauea volcano is the main vent for this hotspot and has been actively erupting since 1983.
This enormous volcanic island chain, much of which is underwater, stretches across the Pacific for almost 6,000 km. The seamount chain’s most striking feature is a sharp 60-degree bend located at the midpoint, which marks a significant change in plate movement direction that occurred 50 million years ago. The change in direction has been more often linked to a plate reconfiguration, but also to other things like plume migration.
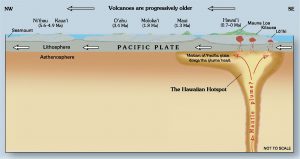
In an attempt to map the Hawaiian mantle plume as far down as the lower mantle, scientists have used tomography, a type of three-dimensional seismic imaging. This information—along with other evidence gathered from rock ages, vegetation types, and island size—indicate the oldest islands in the chain are located the furthest away from the active hotspot.
2.7.2 Yellowstone hotspot
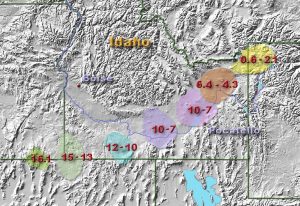
Like the Hawaiian version, the Yellowstone hotspot is formed by magma rising through the lithosphere. What makes it different is this hotspot is located under a thick, continental plate. Hawaii sits on a thin oceanic plate, which is easily breached by magma coming to the surface. At Yellowstone, the thick continental plate presents a much more difficult barrier for magma to penetrate. When it does emerge, the eruptions are generally much more violent. Thankfully they are also less frequent.
Over 15 million years of eruptions by this hotspot have carved a curved path across the western United States. It has been suggested the Yellowstone hotspot is connected to the much older Columbia River flood basalts and even to 70 million-year-old volcanism found in the Yukon region of Canada.
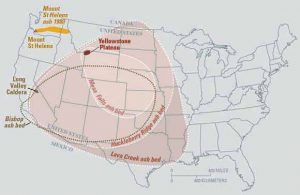
The most recent major eruption of this hotspot created the Yellowstone Caldera and Lava Creek tuff formation approximately 631,000 years ago. The eruption threw 1,000 cubic kilometers of ash and magma into the atmosphere, some of which was found as far away as Mississippi. Should the hotspot erupt again, scientists predict it will be another massive event. This would be a calamity reaching far beyond the western United States. These super volcanic eruptions fill the earth’s atmosphere with so much gas and ash, they block sunlight from reaching the earth. Not only would this drastically alter climates and environments around the globe, it could affect worldwide food production.
Take this quiz to check your comprehension of this section.

Summary

Plate tectonics is a unifying theory; it explains nearly all of the major geologic processes on Earth. Since its early inception in the 1950s and 1960s, geologists have been guided by this revolutionary perception of the world. The theory of plate tectonics states the surface layer of the Earth is broken into a network of solid, relatively brittle plates. Underneath the plates is a much hotter and more ductile layer that contains zones of convective upwelling generated by the interior heat of Earth. These convection currents move the surface plates around—bringing them together, pulling them apart, and shearing them side-by-side. Earthquakes and volcanoes form at the boundaries where the plates interact, with the exception of volcanic hotspots, which are not caused by plate movement.
Take this quiz to check your comprehension of this Chapter.

References
- Aitta, A., 2006, Iron melting curve with a tricritical point: J. Stat. Mech., v. 2006, no. 12, p. P12015.
- Alfe, D., Gillan, M.J., and Price, G.D., 2002, Composition and temperature of the Earth’s core constrained by combining ab initio calculations and seismic data: Earth Planet. Sci. Lett., v. 195, no. 1, p. 91–98.
- Atwater, T., 1970, Implications of Plate Tectonics for the Cenozoic Tectonic Evolution of Western North America: Geol. Soc. Am. Bull., v. 81, no. 12, p. 3513–3536., doi: 10.1130/0016-7606(1970)81[3513:IOPTFT]2.0.CO;2.
- Bacon, F., and Montagu, B., 1848, The Works of Francis Bacon, Lord Chancellor of England: With a Life of the Author: The Works of Francis Bacon, Lord Chancellor of England: With a Life of the Author, Parry & McMillan, The Works of Francis Bacon, Lord Chancellor of England: With a Life of the Author.
- Benioff, H., 1949, Seismic evidence for the fault origin of oceanic deeps: Geological Society of America Bulletin, v. 60, no. 12, p. 1837–1856., doi: 10.1130/0016-7606(1949)60[1837:SEFTFO]2.0.CO;2.
- Birch, F., 1952, Elasticity and constitution of the Earth’s interior: J. Geophys. Res., v. 57, no. 2, p. 227–286., doi: 10.1029/JZ057i002p00227.
- Birch, F., 1964, Density and composition of mantle and core: J. Geophys. Res., v. 69, no. 20, p. 4377–4388.
- Bott, M.H.P., 1993, Modelling the plate-driving mechanism: Journal of the Geological Society, v. 150, no. 5, p. 941–951., doi: 10.1144/gsjgs.150.5.0941.
- Coats, R.R., 1962, Magma type and crustal structure in the Aleutian Arc, in The Crust of the Pacific Basin: American Geophysical Union, p. 92–109., doi: 10.1029/GM006p0092.
- Conrad, C.P., and Lithgow-Bertelloni, C., 2002, How mantle slabs drive plate tectonics: Science (New York, N.Y.), v. 298, no. 5591, p. 207–209., doi: 10.1126/science.1074161.
- Corliss, J.B., Dymond, J.G., Gordon, L.I., Edmond, J.M., von Heezen, R.P., Ballard, R.D., Green, K., Williams, D.L., Bainbridge, A., Crane, K., and van Andel, T.H., 1979, Submarine thermal springs on the Galapagos Rift: Science, v. 203, p. 107321083.
- Davis, E.E., and Lister, C.R.B., 1974, Fundamentals of ridge crest topography: Earth Planet. Sci. Lett., v. 21, no. 4, p. 405–413.
- Dawson, J.B., Pinkerton, H., Norton, G.E., and Pyle, D.M., 1990, Physicochemical properties of alkali carbonatite lavas:Data from the 1988 eruption of Oldoinyo Lengai, Tanzania: Geology, v. 18, no. 3, p. 260–263.
- Drake, E.T., 1976, Alfred Wegener’s reconstruction of Pangea: Geology, v. 4, no. 1, p. 41–44., doi: <a href= »https://doi.org/10.1130/0091-7613(1976)42.0.CO;2″>10.1130/0091-7613(1976)4<41:AWROP>2.0.CO;2.
- Engdahl, E.R., Flynn, E.A., and Masse, R.P., 1974, Differential PkiKP travel times and the radius of the core: Geophysical J Royal Astro Soc, v. 40, p. 457–463.
- Ewing, M., Ewing, J.I., and Talwani, M., 1964, Sediment distribution in the oceans: The Mid-Atlantic Ridge: Geol. Soc. Am. Bull., v. 75, no. 1, p. 17–36., doi: 10.1130/0016-7606(1964)75[17:SDITOT]2.0.CO;2.
- Ewing, M., Houtz, R., and Ewing, J., 1969, South Pacific sediment distribution: J. Geophys. Res., v. 74, no. 10, p. 2477–2493., doi: 10.1029/JB074i010p02477.
- Fernandez, L.M., and Careaga, J., 1968, The thickness of the crust in central United States and La Paz, Bolivia, from the spectrum of longitudinal seismic waves: Bull. Seismol. Soc. Am., v. 58, no. 2, p. 711–741.
- Fluegel, von H.W., 1980, Wegener-Ampferer-Schwinner. Ein Beitrag zur Geschichte der Geologie in Österreich: Mitt. Oesterr. Geol. Ges., v. 73, p. 237–254.
- Forsyth, D.W., 1975, The Early Structural Evolution and Anisotropy of the Oceanic Upper Mantle: Geophys. J. Int., v. 43, no. 1, p. 103–162., doi: 10.1111/j.1365-246X.1975.tb00630.x.
- Frankel, H., 1982, The Development, Reception, and Acceptance of the Vine-Matthews-Morley Hypothesis: Hist. Stud. Phys. Biol. Sci., v. 13, no. 1, p. 1–39.
- Fukao, Y., and Obayashi, M., 2013, Subducted slabs stagnant above, penetrating through, and trapped below the 660 km discontinuity: J. Geophys. Res. [Solid Earth], v. 118, no. 11, p. 2013JB010466.
- Hagstrum, J.T., 2005, Antipodal hotspots and bipolar catastrophes: Were oceanic large-body impacts the cause? Earth Planet. Sci. Lett., v. 236, no. 1–2, p. 13–27.
- Hanks, T.C., and Anderson, D.L., 1969, The early thermal history of the earth: Phys. Earth Planet. Inter., v. 2, no. 1, p. 19–29.
- Heezen, B.C., and Tharp, M., 1965, Tectonic Fabric of the Atlantic and Indian Oceans and Continental Drift: Philosophical Transactions of the Royal Society of London A: Mathematical, Physical and Engineering Sciences, v. 258, no. 1088, p. 90–106., doi: 10.1098/rsta.1965.0024.
- Heller, P.L., Bowdler, S.S., Chambers, H.P., Coogan, J.C., Hagen, E.S., Shuster, M.W., Winslow, N.S., and Lawton, T.F., 1986, Time of initial thrusting in the Sevier orogenic belt, Idaho-Wyoming and Utah: Geology, v. 14, no. 5, p. 388–391.
- Herak, D., and Herak, M., 2007, Andrija Mohorovičić (1857-1936)—On the occasion of the 150th anniversary of his birth: Seismol. Res. Lett., v. 78, no. 6, p. 671–674.
- Hess, H.H., 1962, History of ocean basins: Petrologic studies, v. 4, p. 599–620.
- Hutson, P., Middleton, J., and Miller, D., 2003, Collision Zones: Online, http://www.geosci.usyd.edu.au/users/prey/ACSGT/EReports/eR.2003/GroupD/Report1/web%20pages/contents.html, accessed June 2017.
- Isacks, B., Oliver, J., and Sykes, L.R., 1968, Seismology and the new global tectonics: J. Geophys. Res., v. 73, no. 18, p. 5855–5899.
- Ito, E., and Takahashi, E., 1989, Postspinel transformations in the system Mg2SiO4-Fe2SiO4 and some geophysical implications: J. Geophys. Res. [Solid Earth], v. 94, no. B8, p. 10637–10646.
- Jacoby, W.R., 1981, Modern concepts of Earth dynamics anticipated by Alfred Wegener in 1912: Geology, v. 9, no. 1, p. 25–27., doi: <a href= »https://doi.org/10.1130/0091-7613(1981)92.0.CO;2″>10.1130/0091-7613(1981)9<25:MCOEDA>2.0.CO;2.
- Jakosky, B.M., Grebowsky, J.M., Luhmann, J.G., Connerney, J., Eparvier, F., Ergun, R., Halekas, J., Larson, D., Mahaffy, P., McFadden, J., Mitchell, D.F., Schneider, N., Zurek, R., Bougher, S., and others, 2015, MAVEN observations of the response of Mars to an interplanetary coronal mass ejection: Science, v. 350, no. 6261, p. aad0210.
- James, D.E., Fouch, M.J., Carlson, R.W., and Roth, J.B., 2011, Slab fragmentation, edge flow and the origin of the Yellowstone hotspot track: Earth Planet. Sci. Lett., v. 311, no. 1–2, p. 124–135.
- Ji, Y., and Nataf, H.-C., 1998, Detection of mantle plumes in the lower mantle by diffraction tomography: Hawaii: Earth Planet. Sci. Lett., v. 159, no. 3–4, p. 99–115.
- Johnston, S.T., Jane Wynne, P., Francis, D., Hart, C.J.R., Enkin, R.J., and Engebretson, D.C., 1996, Yellowstone in Yukon: The Late Cretaceous Carmacks Group: Geology, v. 24, no. 11, p. 997–1000.
- Kearey, P., Klepeis, K.A., and Vine, F.J., 2009, Global Tectonics: Oxford ; Chichester, West Sussex ; Hoboken, NJ, Wiley-Blackwell, 496 p.
- Le Pichon, X., 1968, Sea-floor spreading and continental drift: J. Geophys. Res., v. 73, no. 12, p. 3661–3697.
- Lehmann, I., 1936, P’, Publ: Bur. Centr. Seism. Internat. Serie A, v. 14, p. 87–115.
- Mantovani, R., 1889, Les fractures de l’écorce terrestre et la théorie de Laplace: Bull. Soc. Sc. et Arts Réunion, p. 41–53.
- Mason, R.G., 1958, A magnetic survey off the west coast of the United-States between latitudes 32-degrees-N and 36-degrees-N longitudes 121-degrees-W and 128-degrees-W: Geophysical Journal of the Royal Astronomical Society, v. 1, no. 4, p. 320.
- Mason, R.G., and Raff, A.D., 1961, Magnetic Survey Off the West Coast of North America, 32° N. Latitude to 42° N. Latitude: Geological Society of America Bulletin, v. 72, no. 8, p. 1259–1265., doi: 10.1130/0016-7606(1961)72[1259:MSOTWC]2.0.CO;2.
- McCollom, T.M., 1999, Methanogenesis as a potential source of chemical energy for primary biomass production by autotrophic organisms in hydrothermal systems on Europa: J. Geophys. Res., v. 104, no. E12, p. 30729–30742., doi: 10.1029/1999JE001126.
- McKenzie, D.P., and Parker, R.L., 1967, The North Pacific: an Example of Tectonics on a Sphere: Nature, v. 216, p. 1276–1280., doi: 10.1038/2161276a0.
- Miller, A.R., Densmore, C.D., Degens, E.T., Hathaway, J.C., Manheim, F.T., McFarlin, P.F., Pocklington, R., and Jokela, A., 1966, Hot brines and recent iron deposits in deeps of the Red Sea: Geochimica et Cosmochimica Acta, v. 30, no. 3, p. 341–359., doi: 10.1016/0016-7037(66)90007-X.
- Morgan, W.J., 1968, Rises, trenches, great faults, and crustal blocks: J. Geophys. Res., v. 73, no. 6, p. 1959–1982., doi: 10.1029/JB073i006p01959.
- Mueller, S., and Phillips, R.J., 1991, On the initiation of subduction: J. Geophys. Res. [Solid Earth], v. 96, no. B1, p. 651–665.
- Oldham, R.D., 1906, The constitution of the interior of the Earth, as revealed by earthquakes: Q. J. Geol. Soc. London, v. 62, no. 1–4, p. 456–475.
- Pasyanos, M.E., 2010, Lithospheric thickness modeled from long-period surface wave dispersion: Tectonophysics, v. 481, no. 1–4, p. 38–50.
- Powell, R.E., and Weldon, R.J., 1992, Evolution of the San Andreas fault: Annu. Rev. Earth Planet. Sci., v. 20, p. 431.
- Raff, A.D., and Mason, R.G., 1961, Magnetic Survey Off the West Coast of North America, 40 N. Latitude to 52 N. Latitude: Geological Society of America Bulletin, v. 72, no. 8, p. 1267–1270., doi: 10.1130/0016-7606(1961)72[1267:MSOTWC]2.0.CO;2.
- Runcorn, S.K., 1965, Palaeomagnetic comparisons between Europe and North America: Philosophical Transactions of the Royal Society of London A: Mathematical, Physical and Engineering Sciences, v. 258, no. 1088, p. 1–11.
- Saito, T., Ewing, M., and Burckle, L.H., 1966, Tertiary sediment from the mid-atlantic ridge: Science, v. 151, no. 3714, p. 1075–1079., doi: 10.1126/science.151.3714.1075.
- Satake, K., and Atwater, B.F., 2007, Long-term perspectives on giant earthquakes and tsunamis at subduction zones*: Annu. Rev. Earth Planet. Sci., v. 35, p. 349–374.
- Scheidegger, A.E., 1953, Examination of the physics of theories of orogenesis: Geol. Soc. Am. Bull., v. 64, no. 2, p. 127–150., doi: 10.1130/0016-7606(1953)64[127:EOTPOT]2.0.CO;2.
- Simpson, G.G., 1943, Mammals and the nature of continents: Am. J. Sci., v. 241, no. 1, p. 1–31.
- Starr, A.M., 2015, Ambient resonance of rock arches: Salt Lake City, Utah, University of Utah, 134 p.
- Stern, R.J., 1998, A subduction primer for instructors of introductory geology courses and authors of introductory-geology textbooks: J. Geosci. Educ., v. 46, p. 221.
- Stern, R.J., 2004, Subduction initiation: spontaneous and induced: Earth Planet. Sci. Lett., v. 226, no. 3–4, p. 275–292.
- Stich, D., Mancilla, F. de L., Pondrelli, S., and Morales, J., 2007, Source analysis of the February 12th 2007, Mw 6.0 Horseshoe earthquake: Implications for the 1755 Lisbon earthquake: Geophys. Res. Lett., v. 34, no. 12, p. L12308.
- Tatsumi, Y., 2005, The subduction factory: how it operates in the evolving Earth: GSA Today, v. 15, no. 7, p. 4.
- Todo, Y., Kitazato, H., Hashimoto, J., and Gooday, A.J., 2005, Simple foraminifera flourish at the ocean’s deepest point: Science, v. 307, no. 5710, p. 689., doi: 10.1126/science.1105407.
- Tolstoy, I., and Ewing, M., 1949, North Atlantic hydrography and the Mid-Atlantic Ridge: Geol. Soc. Am. Bull., v. 60, no. 10, p. 1527–1540., doi: 10.1130/0016-7606(1949)60[1527:NAHATM]2.0.CO;2.
- Vine, F.J., and Matthews, D.H., 1963, Magnetic anomalies over oceanic ridges: Nature, v. 199, no. 4897, p. 947–949.
- Wächtershäuser, G., 1990, Evolution of the first metabolic cycles: Proc. Natl. Acad. Sci. U. S. A., v. 87, no. 1, p. 200–204.
- Wadati, K., 1935, On the activity of deep-focus earthquakes in the Japan Islands and neighbourhoods: Geophys. Mag., v. 8, no. 3–4, p. 305–325.
- Waszek, L., Irving, J., and Deuss, A., 2011, Reconciling the hemispherical structure of Earth/’s inner core with its super-rotation: Nat. Geosci., v. 4, no. 4, p. 264–267., doi: 10.1038/ngeo1083.
- Wegener, A., 1912, Die Entstehung der Kontinente: Geol. Rundsch., v. 3, no. 4, p. 276–292., doi: 10.1007/BF02202896.
- Wegener, A., 1920, Die entstehung der kontinente und ozeane: Рипол Классик.
- Wells, H.G., Huxley, J., and Wells, G.P., 1931, The Science of Life: Philosophy, v. 6, no. 24, p. 506–507.
- White, I.C., and Moreira, C., 1908, Commissão de estudos das minas de Carvão de Pedra do Brazil:
- de Wijs, G.A., Kresse, G., Vočadlo, L., Dobson, D., Alfè, D., Gillan, M.J., and Price, G.D., 1998, The viscosity of liquid iron at the physical conditions of the Earth’s core: Nature, v. 392, no. 6678, p. 805–807., doi: 10.1038/33905.
- Wilson, J.T., 1966, Did the Atlantic close and then re-open? Nature.
- Wilson, M., 1993, Plate-moving mechanisms: constraints and controversies: Journal of the Geological Society, v. 150, no. 5, p. 923–926., doi: 10.1144/gsjgs.150.5.0923.
- Wyllie, P.J., 1970, Ultramafic rocks and the upper mantle, in Morgan, B.A., editor, Fiftieth anniversary symposia: Mineralogy and petrology of the Upper Mantle; Sulfides; Mineralogy and geochemistry of non-marine evaporites: Washington, DC, Mineralogical Society of America, p. 3–32.
- Zhou, Z., 2004, The origin and early evolution of birds: discoveries, disputes, and perspectives from fossil evidence: Naturwissenschaften, v. 91, no. 10, p. 455–471.
Mention de la source du contenu multimédia
- SunRiver
- Tectonic_plates_boundaries_detailed-en.svg
- Alfred_Wegener_ca.1924-30
- _Antonio_Snider-Pellegrini_Opening_of_the_Atlantic
- ElevationWorld
- Wegener_fossil_map.svg
- Convection
- Global plate motion 2008-04-17
- Deep sea vent chemistry diagram
- Marie Tharp YouTube QR Code
- Earths magnetic field schematic
- Earth Magnetic Field Declination from 1590 to 1990
- magnetic stripes
- Benioff zone
- John Tuzo Wilson in 1992
- Continental Drive Activity QR Code
- 2.1 Did I Get It QR Code
- Earth cutaway schematic-en
- MohoDepth
- Iddingsite
- TolucaMeteorite
- Plates tect2 en
- Earth’s Inner Layers denoting the LAB
- Perovskite
- Inge Lehmann 1932
- Spinning Outer Core
- Layers of Earth Practice QR Code
- Passive Contiental Margin
- Tectonic_plate_boundaries
- 2.2 Did I Get It QR Code
- World geologic provinces
- Subduction Animation QR Code
- Subduction-en
- Terrane
- USGS Terranes
- 1755 Lisbon Earthquake Location
- SundaMegathrustSeismicity
- Forearc
- Shallow subduction Laramide orogeny
- OceanContSub
- OceanSub
- ContCollision
- Pangaea continents
- ZagrosFTB
- ItalyPillowBasalt
- India-Asia Collision Animation QR Code
- 2.3 Did I Get It QR Code
- Horst-Graben
- Topographic Afar
- Basin range province
- Rift Atlantic Animation QR Code
- 02.4_Ocean-birth.svg
- Age Oceanic Lith
- atwater_mag_reversal_mid_ocean_ridge
- Atwater – Spreading along several mid-ocean ridges GIF
- Oceanic.Stripe.Magnetic.Anomalies.Scheme
- Pangea Animation QR Code
- BlackSmoker
- 2.4 Did I Get It QR Code
- Strike slip fault
- Sanandreas
- Restraining Bend
- Releasing bend
- Wallace Creek offset across the San Andreas Fault
- Plate Tectonics YouTube QR Code
- 2.5 Did I Get It QR Code
- Wilson-cycle hg
- Hotspot(geology)-1
- CourtHotspots
- Hawaii-Emperor engl
- Hawaii hotspot cross-sectional diagram
- HotspotsSRP update2013
- Yellowstone volcano-ash beds
- 2.6-7 Did I Get It QR Code
- Plate Tectonics Basics YouTube QR Code
- Ch.2 Review QR Code
Rock with abraded surfaces formed in deserts.
Potentially extractible and valuable material, but unproven.
Erosional rock face caused by sand abrasion.
Glaciers that form in cool or mountainous areas.
QR Code generated with QRCode Monkey. All generated QR Codes are 100% free and can be used for whatever you want. This includes all commercial purposes.
A process where ice from the ends of glaciers falls off into the ocean.
Smooth surface carved in harder rocks by glacial action.
The line between the zone of accumulation and the zone of ablation.
Lake that forms next to a glacier because of crustal loading.
The measure of the amount of circular or elliptical nature of the Earth's orbit.
Groves scratched in rock by glacial action.
Rob Lavinsky, iRocks.com – CC-BY-SA-3.0 [CC BY-SA 3.0], via Wikimedia Commons
The amount of light that is reflected off of an object like the Earth.
(Source: National Park Service modified after Garber et al. 1989)
A system which adds into itself.
Minerals that have a luster that is not similar to metal, and typically do not contain valuable metals like copper, lead, zinc, tin, etc.
Large surface mine with opening carved into the ground.
The thin, outer layer of the Earth which makes up the rocky bottom of the ocean basins. It is made of rocks similar to basalt, and as it cools, even become more dense than the upper mantle below.
By USGS (unknown photographer) [Public domain], via Wikimedia Commons
Lowest layer of the soil (C), which is mechanically weathered (not chemically weathered) bedrock.
Planar flow of water over land surfaces.
Component of the gravitational force which pushes material downslope.
Photo credit to Louis J. Maher, Jr.
11 Water
KEY CONCEPTS
-
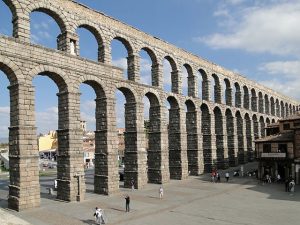
Example of a Roman aqueduct in Segovia, Spain. Describe the processes of the water cycle
- Describe drainage basins, watershed protection, and water budget
- Describe reasons for water laws, who controls them, and how water is shared in the western U.S.
- Describe zone of transport, zone of sediment production, zone of deposition, and equilibrium
- Describe stream landforms: channel types, alluvial fans, floodplains, natural levees, deltas, entrenched meanders, and terraces
- Describe the properties required for a good aquifer; define confining layer water table
- Describe three major groups of water contamination and three types of remediation
- Describe karst topography, how it is created, and the landforms that characterize it
All life on Earth requires water. The hydrosphere (Earth’s water) is an important agent of geologic change. Water shapes our planet by depositing minerals, aiding lithification, and altering rocks after they are lithified. Water carried by subducted oceanic plates causes flux melting of upper mantle material. Water is among the volatiles in magma and emerges at the surface as steam in volcanoes.
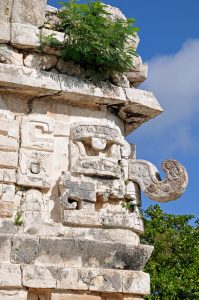
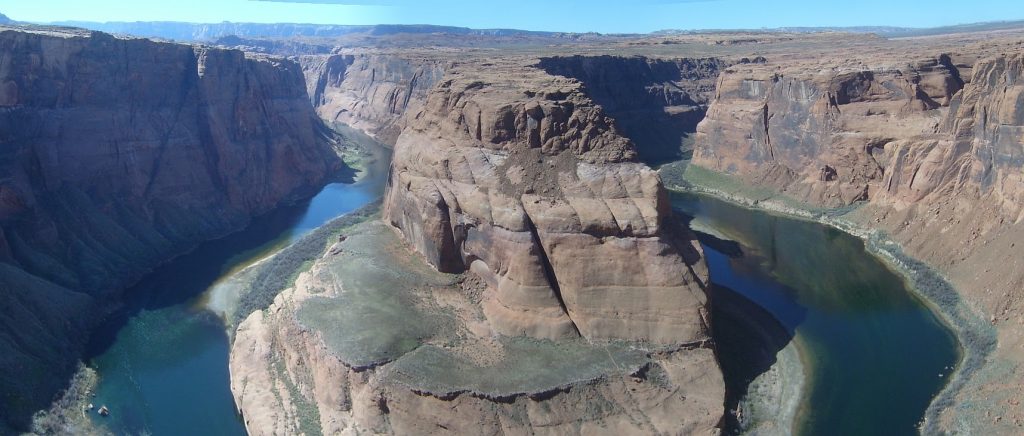
Humans rely on suitable water sources for consumption, agriculture, power generation, and many other purposes. In pre-industrial civilizations, the powerful controlled water resources [1, 2]. As shown in the figures, two thousand year old Roman aqueducts still grace European, Middle Eastern, and North African skylines. Ancient Mayan architecture depicts water imagery such as frogs, water-lilies, water fowl to illustrate the importance of water in their societies [3]. In the drier lowlands of the Yucatan Peninsula, mask facades of the hooked-nosed rain god, Chac (or Chaac) are prominent on Mayan buildings such as the Kodz Poop (Temple of the Masks, sometimes spelled Coodz Poop) at the ceremonial site of Kabah. To this day government controlled water continues to be an integral part of most modern societies.
11.1 Water Cycle
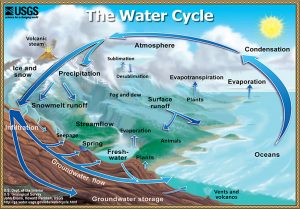
The water cycle is the continuous circulation of water in the Earth's atmosphere. During circulation, water changes between solid, liquid, and gas (water vapor) and changes location. The processes involved in the water cycle are evaporation, transpiration, condensation, precipitation, and runoff.
Evaporation is the process by which a liquid is converted to a gas. Water evaporates when solar energy warms the water sufficiently to excite the water molecules to the point of vaporization. Evaporation occurs from oceans, lakes, and streams and the land surface. Plants contribute significant amounts of water vapor as a byproduct of photosynthesis called transpiration that occurs through the minute pores of plant leaves. The term evapotranspiration refers to these two sources of water entering the atmosphere and is commonly used by geologists.
Water vapor is invisible. Condensation is the process of water vapor transitioning to a liquid. Winds carry water vapor in the atmosphere long distances. When water vapor cools or when air masses of different temperatures mix, water vapor may condense back into droplets of liquid water. These water droplets usually form around a microscopic piece of dust or salt called condensation nuclei. These small droplets of liquid water suspended in the atmosphere become visible as in a cloud. Water droplets inside clouds collide and stick together, growing into larger droplets. Once the water droplets become big enough, they fall to Earth as rain, snow, hail, or sleet.
Once precipitation has reached the Earth's surface, it can evaporate or flow as runoff into streams, lakes, and eventually back to the oceans. Water in streams and lakes is called surface water. Or water can also infiltrate into the soil and fill the pore spaces in the rock or sediment underground to become groundwater. Groundwater slowly moves through rock and unconsolidated materials. Some groundwater may reach the surface again, where it discharges as springs, streams, lakes, and the ocean. Also, surface water in streams and lakes can infiltrate again to recharge groundwater. Therefore, the surface water and groundwater systems are connected.

Take this quiz to check your comprehension of this section.

11.2 Water Basins and Budgets
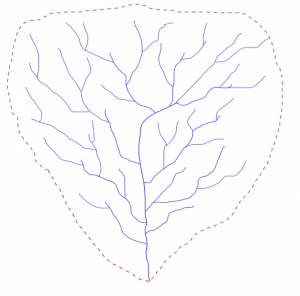
The basic unit of division of the landscape is the drainage basin, also known as a catchment or watershed. It is the area of land that captures precipitation and contributes runoff to a stream or stream segment [4]. Drainage divides are local topographic high points that separate one drainage basin from another [5]. Water that falls on one side of the divide goes to one stream, and water that falls on the other side of the divide goes to a different stream. Each stream, tributary and streamlet has its own drainage basin. In areas with flatter topography, drainage divides are not as easily identified but they still exist [6].
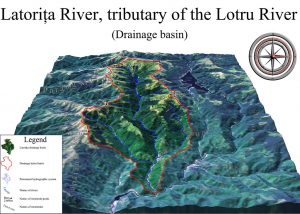
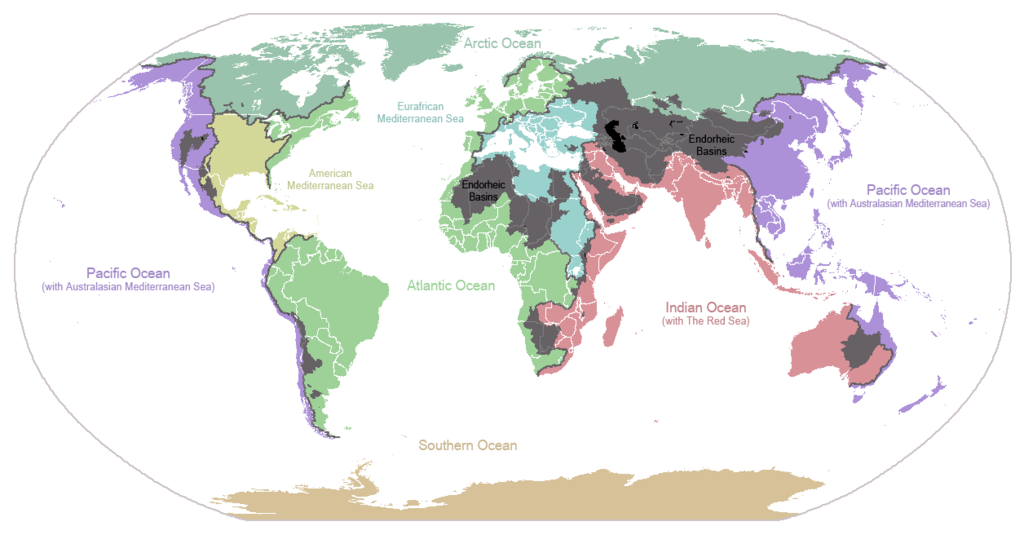
The headwater is where the stream begins. Smaller tributary streams combine downhill to make the larger trunk of the stream. The mouth is where the stream finally reaches its end. The mouth of most streams is at the ocean. However, a rare number of streams do not flow to the ocean, but rather end in a closed basin (or endorheic basin) where the only outlet is evaporation. Most streams in the Great Basin of Western North America end in endorheic basins. For example, in Salt Lake County, Utah, Little Cottonwood Creek and the Jordan River flow into the endorheic Great Salt Lake where the water evaporates.
Perennial streams flow all year round. Perennial streams occur in humid or temperate climates where there is sufficient rainfall and low evaporation rates. Water levels rise and fall with the seasons, depending on the discharge. Ephemeral streams flow only during rain events or the wet season. In arid climates, like Utah, many streams are ephemeral. These streams occur in dry climates with low amounts of rainfall and high evaporation rates. Their channels are often dry washes or arroyos for much of the year and their sudden flow causes flash floods [7].
Along Utah’s Wasatch Front, the urban area extending north to south from Brigham City to Provo, there are several watersheds that are designated as “watershed protection areas” that limit the type of use allowed in those drainages in order to protect culinary water. Dogs and swimming are limited in those watersheds because of the possibility of contamination by harmful bacteria and substances to the drinking supply of Salt Lake City and surrounding municipalities.
Water in the water cycle is very much like money in a personal budget. Income includes precipitation and stream and groundwater inflow. Expenses include groundwater withdrawal, evaporation, and stream and groundwater outflow. If the expenses outweigh the income, the water budget is not balanced. In this case, water is removed from savings, i.e. water storage, if available. Reservoirs, snow, ice, soil moisture, and aquifers all serve as storage in a water budget. In dry regions, the water is critical for sustaining human activities. Understanding and managing the water budget is an ongoing political and social challenge.
Hydrologists create groundwater budgets within any designated area, but they are generally made for watershed (basin) boundaries, because groundwater and surface water are easier to account for within these boundaries. Water budgets can be created for state, county, or aquifer extent boundaries as well. The groundwater budget is an essential component of the hydrologic model; hydrologists use measured data with a conceptual workflow of the model to better understand the water system.
Take this quiz to check your comprehension of this section.

11.3 Water Use and Distribution
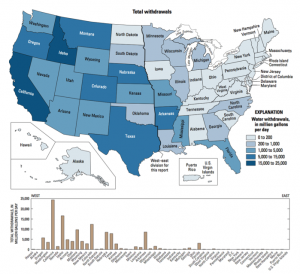
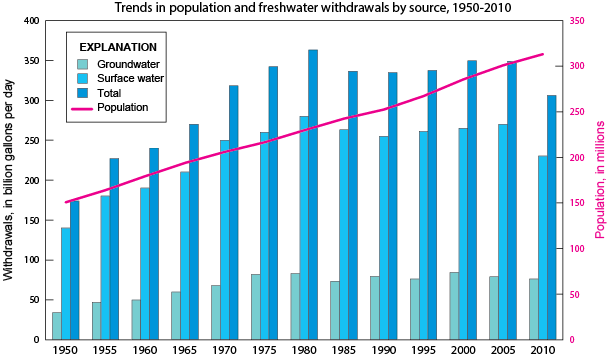
In the United States, 1,344 billion L (355 billion gallons) of ground and surface water are used each day, of which 288 billion L (76 billion gallons) are fresh groundwater. The state of California uses 16% of national groundwater [8].
Utah is the second driest state in the United States. Nevada, having a mean statewide precipitation of 31 cm (12.2 inches) per year, is the driest. Utah also has the second highest per capita rate of total domestic water use of 632.16 L (167 gallonsL per day per person [8]. With the combination of relatively high demand and limited quantity, Utah is at risk for water budget deficits.
11.3.1 Surface Water Distribution
Fresh water is a precious resource and should not be taken for granted, especially in dry climates. Surface water makes up only 1.2% of the fresh water available on the planet, and 69% of that surface water is trapped in ground ice and permafrost. Stream water accounts for only 0.006% of all freshwater and lakes contain only 0.26% of the world’s fresh water [9].
Global circulation patterns are the most important factor in distributing surface water through precipitation. Due to the Coriolis effect and the uneven heating of the Earth, air rises near the equator and near latitudes 60° north and south. Air sinks at the poles and latitudes 30° north and south (see Chapter 13). Land masses near rising air are more prone to humid and wet climates. Land masses near sinking air, which inhibits precipitation, are prone to dry conditions [10, 11]. Prevailing winds, ocean circulation patterns such as the Gulf Stream’s effects on eastern North America, rain shadows (the dry leeward sides of mountains), and even the proximity of bodies of water can affect local climate patterns. When this moist air collides with the nearby mountains causing it to rise and cool, the moisture may fall out as snow or rain on nearby areas in a phenomenon known as “lake-effect precipitation.” [12]
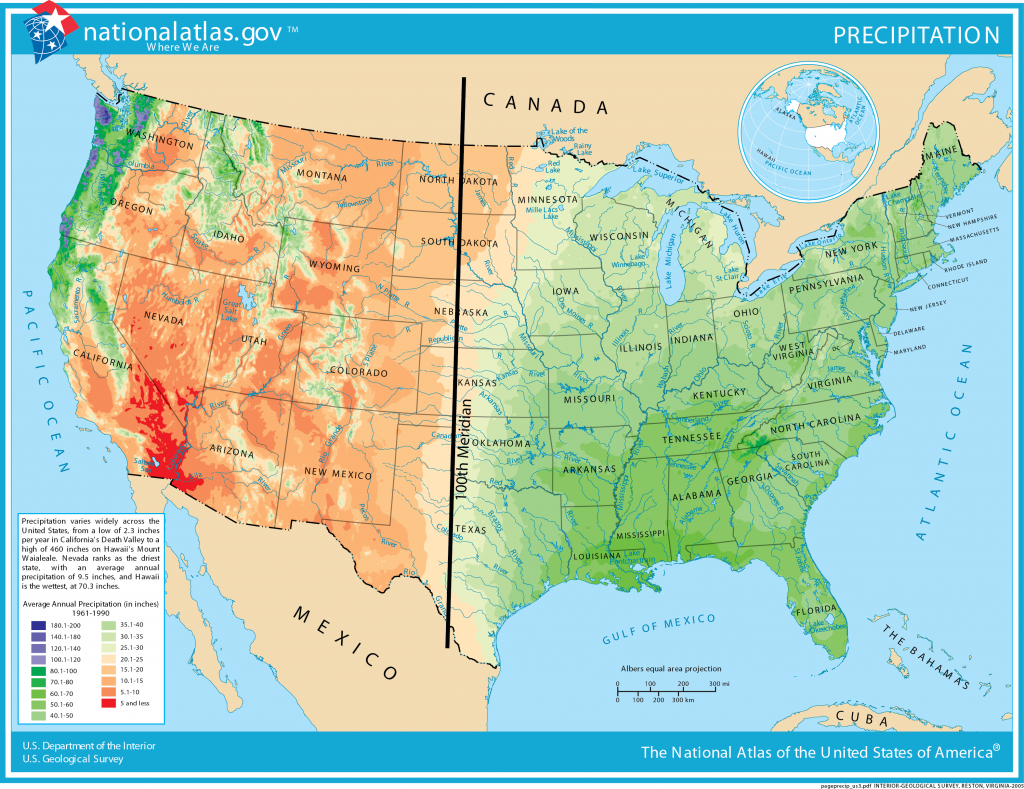
In the United States, the 100th meridian roughly marks the boundary between the humid and arid parts of the country. Growing crops west of the 100th meridian requires irrigation [13]. In the west, surface water is stored in reservoirs and mountain snowpacks [14], then strategically released through a system of canals during times of high water use.
Some of the driest parts of the western United States are in the Basin and Range Province. The Basin and Range has multiple mountain ranges that are oriented north to south. Most of the basin valleys in the Basin and Range are dry, receiving less than 30 cm (12 inches) of precipitation per year. However, some of the mountain ranges can receive more than 1.52 m (60 inches) of water as snow or snow-water-equivalent. The snow-water equivalent is the amount of water that would result if the snow were melted, as the snowpack is generally much thicker than the equivalent amount of water that it would produce [12].
11.3.2 Groundwater Distribution
| Water source | Water volume
(cubic miles) |
Fresh water (%) | Total water (%) |
|---|---|---|---|
| Oceans, Seas, & Bays | 321,000,000 | -- | 96.5 |
| Ice caps, Glaciers, & Permanent Snow | 5,773,000 | 68.7 | 1.74 |
| Groundwater | 5,614,000 | -- | 1.69 |
| -- Fresh | 2,526,000 | 30.1 | 0.76 |
| -- Saline | 3,088,000 | -- | 0.93 |
| Soil Moisture | 3,959 | 0.05 | 0.001 |
| Ground Ice & Permafrost | 71,970 | 0.86 | 0.022 |
| Lakes | 42,320 | -- | 0.013 |
| -- Fresh | 21,830 | 0.26 | 0.007 |
| -- Saline | 20,490 | -- | 0.006 |
| Atmosphere | 3,095 | 0.04 | 0.001 |
| Swamp Water | 2,752 | 0.03 | 0.0008 |
| Rivers | 509 | 0.006 | 0.0002 |
| Biological Water | 269 | 0.003 | 0.0001 |
| Source: Igor Shiklomanov's chapter "World fresh water resources" in Peter H. Gleick (editor), 1993, Water in Crisis: A Guide to the World's Fresh Water Resources (Oxford University Press, New York)[zotpressInText item="{P7VGIQT4}" format="%num%" brackets="yes" separator="comma"] | |||
Groundwater makes up 30.1% of the fresh water on the planet, making it the most abundant reservoir of fresh water accessible to most humans. The majority of freshwater, 68.7%, is stored in glaciers and ice caps as ice [9]. As the glaciers and ice caps melt due to global warming, this fresh water is lost as it flows into the oceans.
Take this quiz to check your comprehension of this section.

11.4 Water Law
Federal and state governments have put laws in place to ensure the fair and equitable use of water. In the United States, the states are tasked with creating a fair and legal system for sharing water.
11.4.1 Water Rights
Because of the limited supply of water, especially in the western United States, states disperse a system of legal water rights defined as a claim to a portion or all of a water source, such as a spring, stream, well, or lake. Federal law mandates that states control water rights, with the special exception of federally reserved water rights, such as those associated with national parks and Native American tribes, and navigation servitude that maintains navigable water bodies. Each state in the United States has a different way to disperse and manage water rights.
A person, entity, company, or organization, must have a water right to legally extract or use surface or groundwater in their state. Water rights in some western states are dictated by the concept of prior appropriation, or “first in time, first in right,” where the person with the oldest water right gets priority water use during times when there is not enough water to fulfill every water right.
The Colorado River and its tributaries pass through a desert region, including seven states (Wyoming, Colorado, Utah, New Mexico, Arizona, Nevada, California), Native American reservations, and Mexico. As the western United States became more populated and while California was becoming a key agricultural producer, the states along the Colorado River realized that the river was important to sustaining life in the West.
To guarantee certain perceived water rights, these western states recognized that a water budget was necesary for the Colorado River Basin. Thus was enacted the Colorado River Compact in 1922 to ensure that each state got a fair share of the river water. The Compact granted each state a specific volume of water based on the total measured flow at the time. However, in 1922, the flow of the river was higher than its long-term average flow, consequently, more water was allocated to each state than is typically available in the river [16].
Over the next several decades, lawmakers have made many other agreements and modifications regarding the Colorado River Compact, including those agreements that brought about the Hoover Dam (formerly Boulder Dam), and Glen Canyon Dam, and a treaty between the American and Mexican governments. Collectively, the agreements are referred to as “The Law of the River" by the United States Bureau of Reclamation. Despite adjustments to the Colorado River Compact, many believe that the Colorado River is still over-allocated, as the Colorado River flow no longer reaches the Pacific Ocean, its original terminus (base level). Dams along the Colorado River have caused water to divert and evaporate, creating serious water budget concerns in the Colorado River Basin. Predicted drought associated with global warming is causing additional concerns about over-allocating the Colorado River flow in the future.
The Law of the River highlights the complex and prolonged nature of interstate water rights agreements, as well as the importance of water.

The Snake Valley straddles the border of Utah and Nevada with more of the irrigable land area lying on the Utah side of the border. In 1989, the Southern Nevada Water Authority (SNWA) submitted applications for water rights to pipe up to 191,189,707 cu m (155,000 ac-ft) of water per year (an acre-foot of water is one acre covered with water one foot deep) from Spring, Snake, Delamar, Dry Lake, and Cave valleys to southern Nevada, mostly for Las Vegas [17]. Nevada and Utah have attempted a comprehensive agreement, but negotiations have not yet been settled.


11.4.2 Water Quality and Protection
Two major federal laws that protect water quality in the United States are the Clean Water Act and the Safe Drinking Water Act. The Clean Water Act, an amendment of the Federal Water Pollution Control Act, protects navigable waters from dumping and point-source pollution. The Safe Drinking Water Act ensures that water that is provided by public water suppliers, like cities and towns, is safe to drink [18].
The U.S. Environmental Protection Agency Superfund program ensures the cleanup of hazardous contamination, and can be applied to situations of surface water and groundwater contamination. It is part of the Comprehensive Environmental Response, Compensation, and Liability Act of 1980. Under this act, state governments and the U.S. Environmental Protection Agency can use the superfund to pay for remediation of a contaminated site and then file a lawsuit against the polluter to recoup the costs. Or to avoid being sued, the polluter that caused the contamination may take direct action or provide funds to remediate the contamination.
Take this quiz to check your comprehension of this section.

11.5 Surface Water
Geologically, a stream is a body of flowing surface water confined to a channel. Terms such as river, creek and brook are social terms not used in geology. Streams erode and transport sediments, making them the most important agents of the earth’s surface, along with wave action (see Chapter 12) in eroding and transporting sediments. They create much of the surface topography and are an important water resource.
Several factors cause streams to erode and transport sediment, but the two main factors are stream-channel gradient and velocity. Stream-channel gradient is the slope of the stream usually expressed in meters per kilometer or feet per mile. A steeper channel gradient promotes erosion. When tectonic forces elevate a mountain, the stream gradient increases, causing the mountain stream to erode downward and deepen its channel eventually forming a valley. Stream-channel velocity is the speed at which channel water flows. Factors affecting channel velocity include channel gradient which decreases downstream, discharge and channel size which increase as tributaries coalesce, and channel roughness which decreases as sediment lining the channel walls decreases in size thus reducing friction. The combined effect of these factors is that channel velocity actually increases from mountain brooks to the mouth of the stream.
11.5.1 Discharge
Stream size is measured in terms of discharge, the volume of water flowing past a point in the stream over a defined time interval. Volume is commonly measured in cubic units (length x width x depth), shown as feet3 (ft3) or meter3 (m3). Therefore, the units of discharge are cubic feet per second (ft3/sec or cfs). Therefore, the units of discharge are cubic meters per second, (m³/s or cms, or cubic feet per second (ft³/sec or cfs). Stream discharge increases downstream. Smaller streams have less discharge than larger streams. For example, the Mississippi River is the largest river in North America, with an average flow of about 16,990.11 cms (600,000 cfs) [19]. For comparison, the average discharge of the Jordan River at Utah Lake is about 16.25 cms (574 cfs) [20] and for the annual discharge of the Amazon River, (the world’s largest river), annual discharge is about 175,565 cms (6,200,000 cfs) [21].
Discharge can be expressed by the following equation:
Q = V A
- Q = discharge cms (or ft3/sec),
- A = cross-sectional area of the stream channel [width times average depth] as m2 (or in2 or ft2),
- V = average channel velocity m/s (or ft/sec) [7]
At a given location along the stream, velocity varies with stream width, shape, and depth within the stream channel as well. When the stream channel narrows but discharge remains constant, the same volume of water must flows through a narrower space causing the velocity to increase, similar to putting a thumb over the end of a backyard water hose. In addition, during rain storms or heavy snow melt, runoff increases, which increases stream discharge and velocity.
When the stream channel curves, the highest velocity will be on the outside of the bend. When the stream channel is straight and uniformly deep, the highest velocity is in the channel center at the top of the water where it is the farthest from frictional contact with the stream channel bottom and sides. In hydrology, the thalweg of a river is the line drawn that shows its natural progression and deepest channel, as is shown in the diagram.
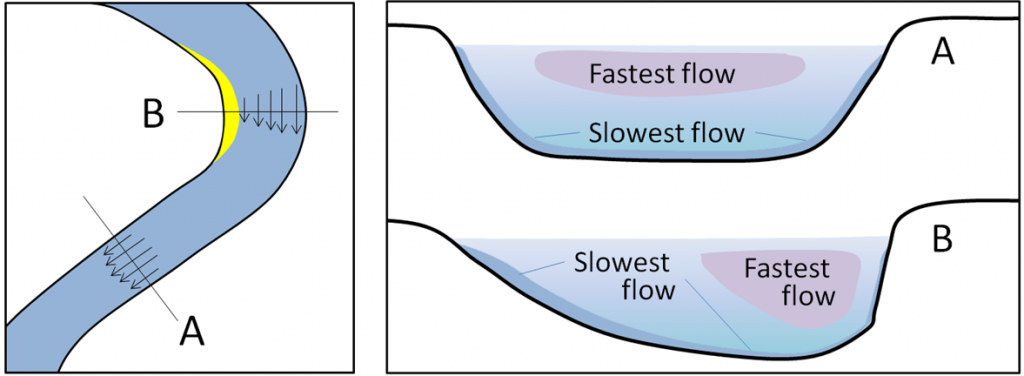
11.5.2 Runoff vs. Infiltration
Factors that dictate whether water will infiltrate into the ground or run off over the land include the amount, type, and intensity of precipitation; the type and amount of vegetation cover; the slope of the land; the temperature and aspect of the land; preexisting conditions; and the type of soil in the infiltrated area. High- intensity rain will cause more runoff than the same amount of rain spread out over a longer duration. If the rain falls faster than the soil’s properties allow it to infiltrate, then the water that cannot infiltrate becomes runoff. Dense vegetation can increase infiltration, as the vegetative cover slows the water particle’s overland flow giving them more time to infiltrate. If a parcel of land has more direct solar radiation or higher seasonal temperatures, there will be less infiltration and runoff, as evapotranspiration rates will be higher. As the land’s slope increases, so does runoff, because the water is more inclined to move downslope than infiltrate into the ground. Extreme examples are a basin and a cliff, where water infiltrates much quicker into a basin than a cliff that has the same soil properties. Because saturated soil does not have the capacity to take more water, runoff is generally greater over saturated soil. Clay-rich soil cannot accept infiltration as quickly as gravel-rich soil.
11.5.3 Drainage Patterns
The pattern of tributaries within a region is called drainage pattern. They depend largely on the type of rock beneath, and on structures within that rock (such as folds and faults). The main types of drainage patterns are dendritic, trellis, rectangular, radial, and deranged. Dendritic patterns are the most common and develop in areas where the underlying rock or sediments are uniform in character, mostly flat lying, and can be eroded equally easily in all directions. Examples are alluvial sediments or flat lying sedimentary rocks. Trellis patterns typically develop where sedimentary rocks have been folded or tilted and then eroded to varying degrees depending on their strength. The Appalachian Mountains in eastern United States have many good examples of trellis drainage. Rectangular patterns develop in areas that have very little topography and a system of bedding planes, joints, or faults that form a rectangular network. A radial pattern forms when streams flow away from a central high point such as a mountain top or volcano, with the individual streams typically having dendritic drainage patterns. In places with extensive limestone deposits, streams can disappear into the groundwater via caves and subterranean drainage and this creates a deranged pattern [4].

11.5.4 Fluvial Processes
Fluvial processes dictate how a stream behaves and include factors controlling fluvial sediment production, transport, and deposition. Fluvial processes include velocity, slope and gradient, erosion, transportation, deposition, stream equilibrium, and base level.
Streams can be divided into three main zones: the many smaller tributaries in the source area, the main trunk stream in the floodplain and the distributaries at the mouth of the stream. Major stream systems like the Mississippi are composed of many source areas, many tributaries and trunk streams, all coalescing into the one main stream draining the region. The zones of a stream are defined as 1) the zone of sediment production (erosion), 2) the zone of transport, and 3) the zone of deposition. The zone of sediment production is located in the headwaters of the stream. In the zone of sediment transport, there is a general balance between erosion of the finer sediment in its channel and transport of sediment across the floodplain. Streams eventually flow into the ocean or end in quiet water with a delta which is a zone of sediment deposition located at the mouth of a stream [6]. The longitudinal profile of a stream is a plot of the elevation of the stream channel at all points along its course and illustrates the location of the three zones [22]
Zone of Sediment Production
The zone of sediment production is located in the headwaters of a stream where rills and gullies erode sediment and contribute to larger tributary streams. These tributaries carry sediment and water further downstream to the main trunk of the stream. Tributaries at the headwaters have the steepest gradient; erosion there produces considerable sediment carried b the stream. Headwater streams tend to be narrow and straight with small or non-existent floodplains adjacent to the channel. Since the zone of sediment production is generally the steepest part of the stream, headwaters are generally located in relatively high elevations. The Rocky Mountains of Wyoming and Colorado west of the Continental Divide contain much of the headwaters for the Colorado River which then flows from Colorado through Utah and Arizona to Mexico. Headwaters of the Mississippi river system lie east of the Continental Divide in the Rocky Mountains and west of the Appalachian Divide.
Zone of Sediment TransPORT
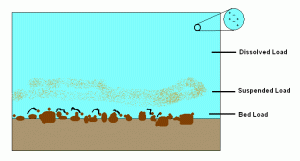
Streams transport sediment great distances from the headwaters to the ocean, the ultimate depositional basins. Sediment transportation is directly related to stream gradient and velocity. Faster and steeper streams can transport larger sediment grains. When velocity slows down, larger sediments settle to the channel bottom. When the velocity increases, those larger sediments are entrained and move again.
Transported sediments are grouped into bedload, suspended load, and dissolved load as illustrated in the above image. Sediments moved along the channel bottom are the bedload that typically consists of the largest and densest particles. Bedload is moved by saltation (bouncing) and traction (being pushed or rolled along by the force of the flow). Smaller particles are picked up by flowing water and carried in suspension as suspended load. The particle size that is carried in suspended and bedload depends on the flow velocity of the stream. Dissolved load in a stream is the total of the ions in solution from chemical weathering, including such common ions such as bicarbonate (-HCO3-), calcium (Ca+2), chloride (Cl-1), potassium (K+1), and sodium (Na+1). The amounts of these ions are not affected by flow velocity.

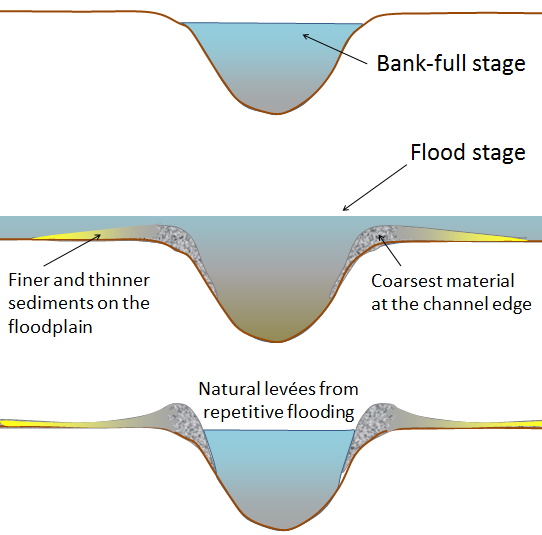
A floodplain is the flat area of land adjacent to a stream channel inundated with flood water on a regular basis. Stream flooding is a natural process that adds sediment to floodplains. A stream typically reaches its greatest velocity when it is close to flooding, known as the bankfull stage. As soon as the flooding stream overtops its banks and flows onto its floodplain, the velocity decreases. Sediment that was being carried by the swiftly moving water is deposited at the edge of the channel, forming a low ridge or natural levée. In addition, sediments are added to the floodplain during this flooding process contributing to fertile soils [4].
Zone of SEDIMENT Deposition
Deposition occurs when bedload and suspended load come to rest on the bottom of the stream channel, lake, or ocean due to decrease in stream gradient and reduction in velocity. While both deposition and erosion occur in the zone of transport such as on point bars and cut banks, ultimate deposition where the stream reaches a lake or ocean. Landforms called deltas form where the stream enters quiet water composed of the finest sediment such as fine sand, silt, and clay.
Equilibrium and Base Level
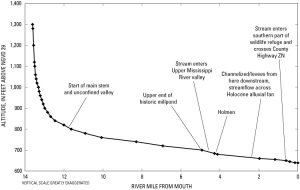
All three stream zones are present in the typical longitudinal profile of a stream which plots the elevation of the channel at all points along its course (see figure). All streams have a long profile. The long profile shows the stream gradient from headwater to mouth. All streams attempt to achieve an energetic balance among erosion, transport, gradient, velocity, discharge, and channel characteristics along the stream’s profile. This balance is called equilibrium, a state called grade.
Another factor influencing equilibrium is base level, the elevation of the stream's mouth representing the lowest level to which a stream can erode. The ultimate base level is, of course, sea-level. A lake or reservoir may also represent base level for a stream entering it. The Great Basin of western Utah, Nevada, and parts of some surrounding states contains no outlets to the sea and provides internal base levels for streams within it. Base level for a stream entering the ocean changes if sea-level rises or falls. Base level also changes if a natural or human-made dam is added along a stream's profile. When base level is lowered, a stream will cut down and deepen its channel. When base level rises, deposition increases as the stream adjusts attempting to establish a new state of equilibrium. A stream that has approximately achieved equilibrium is called a graded stream.
11.5.5 Fluvial Landforms
Stream landforms are the land features formed on the surface by either erosion or deposition. The stream-related landforms described here are primarily related to channel types.
Channel Types
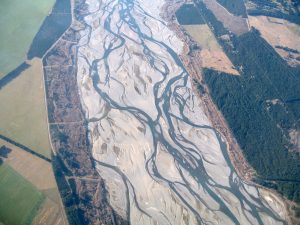
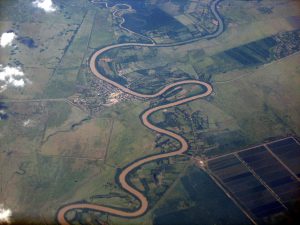
Stream channels can be straight, braided, meandering, or entrenched. The gradient, sediment load, discharge, and location of base level all influence channel type. Straight channels are relatively straight, located near the headwaters, have steep gradients, low discharge, and narrow V-shaped valleys. Examples of these are located in mountainous areas.
Braided streams have multiple channels splitting and recombining around numerous mid-channel bars. These are found in floodplains with low gradients in areas with near sources of coarse sediment such as trunk streams draining mountains or in front of glaciers.
Meandering streams have a single channel that curves back and forth like a snake within its floodplain where it emerges from its headwaters into the zone of transport. Meandering streams are dynamic creating a wide floodplain by eroding and extending meander loops side-to-side. The highest velocity water is located on the outside of a meander bend. Erosion of the outside of the curve creates a feature called a cut bank and the meander extends its loop wider by this erosion.
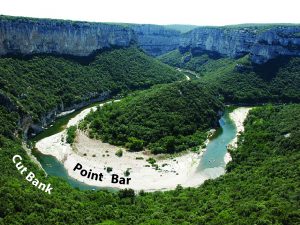
The thalweg of the stream is the deepest part of the stream channel. In the straight parts of the channel, the thalweg and highest velocity are in the center of the channel. But at the bend of a meandering stream, the thalweg shifts toward the cut bank. Opposite the cutbank on the inside bend of the channel is the lowest stream velocity and is an area of deposition called a point bar.
In areas of tectonic uplift such as on the Colorado Plateau, meandering streams that once flowed on the plateau surface have become entrenched or incised as uplift occurred and the stream cut its meandering channel down into bedrock. Over the past several million years, the Colorado River and its tributaries have incised into the flat lying rocks of the plateau by hundreds, even thousands of feet creating deep canyons including the Grand Canyon in Arizona.


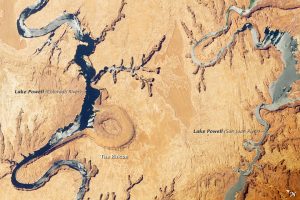
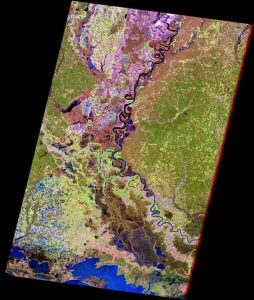
Many fluvial landforms occur on a floodplain associated with a meandering stream. Meander activity and regular flooding contribute to widening the floodplain by eroding adjacent uplands. The stream channels are confined by natural levees that have been built up over many years of regular flooding. Natural levees can isolate and direct flow from tributary channels on the floodplain from immediately reaching the main channel. These isolated streams are called yazoo streams and flow parallel to the main trunk stream until there is an opening in the levee to allow for a belated confluence.

To limit flooding, humans build artificial levees on flood plains. Sediment that breaches the levees during flood stage is called crevasse splays and delivers silt and clay onto the floodplain. These deposits are rich in nutrients and often make good farm land. When floodwaters crest over human-made levees, the levees quickly erode with potentially catastrophic impacts. Because of the good soils, farmers regularly return after floods and rebuild year after year.
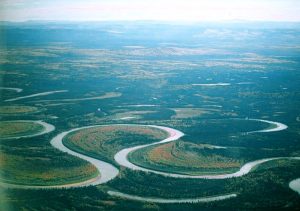
Through erosion on the outsides of the meanders and deposition on the insides, the channels of meandering streams move back and forth across their floodplain over time. On very broad floodplains with very low gradients, the meander bends can become so extreme that they cut across themselves at a narrow neck (see figure) called a cutoff. The former channel becomes isolated and forms an oxbow lake seen on the right of the figure. Eventually the oxbow lake fills in with sediment and becomes a wetland and eventually a meander scar. Stream meanders can migrate and form oxbow lakes in a relatively short amount of time. Where stream channels form geographic and political boundaries, this shifting of channels can cause conflicts.

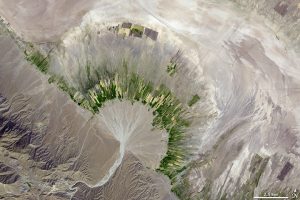
Alluvial fans are a depositional landform created where streams emerge from mountain canyons into a valley. The channel that had been confined by the canyon walls is no longer confined, slows down and spreads out, dropping its bedload of all sizes, forming a delta in the air of the valley. As distributary channels fill with sediment, the stream is diverted laterally, and the alluvial fan develops into a cone shaped landform with distributaries radiating from the canyon mouth. Alluvial fans are common in the dry climates of the West where ephemeral streams emerge from canyons in the ranges of the Basin and Range.

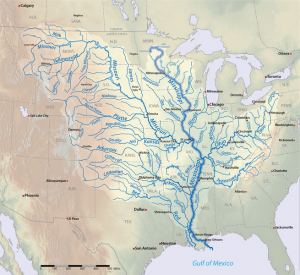
A delta is formedwhen a stream reaches a quieter body of water such as a lake or the ocean and the bedload and suspended load is deposited. If wave erosion from the water body is greater than deposition from the river, a delta will not form. The largest and most famous delta in the United States is the Mississippi River delta formed where the Mississippi River flows into the Gulf of Mexico. The Mississippi River drainage basin is the largest in North America, draining 41% of the contiguous United States [24]. Because of the large drainage area, the river carries a large amount of sediment. The Mississippi River is a major shipping route and human engineering has ensured that the channel has been artificially straightened and remains fixed within the floodplain. The river is now 229 km shorter than it was before humans began engineering it [24]. Because of these restraints, the delta is now focused on one trunk channel and has created a “bird’s foot” pattern. The two NASA images below of the delta show how the shoreline has retreated and land was inundated with water while deposition of sediment was focused at end of the distributaries. These images have changed over a 25 year period from 1976 to 2001. These are stark changes illustrating sea-level rise and land subsidence from the compaction of peat due to the lack of sediment resupply [25].

The formation of the Mississippi River delta started about 7500 years ago when postglacial sea level stopped rising. In the past 7000 years, prior to anthropogenic modifications, the Mississippi River delta formed several sequential lobes. The river abandoned each lobe for a more preferred route to the Gulf of Mexico. These delta lobes were reworked by the ocean waves of the Gulf of Mexico [26]. After each lobe was abandoned by the river, isostatic depression and compaction of the sediments caused basin subsidence and the land to sink.
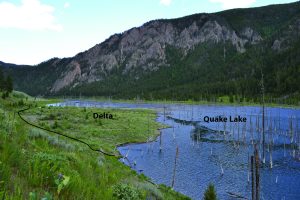
A clear example of how deltas form came from an earthquake. During the 1959 Madison Canyon 7.5 magnitude earthquake in Montana, a large landslide dammed the Madison River forming Quake Lake still there today [27]. A small tributary stream that once flowed into the Madison River, now flows into Quake Lake forming a delta composed of coarse sediment actively eroded from the mountainous upthrown block to the north.
Deltas can be further categorized as wave-dominated or tide-dominated. Wave-dominated deltas occur where the tides are small and wave energy dominates. An example is the Nile River delta in the Mediterranean Sea that has the classic shape of the Greek character (Δ) from which the landform is named. A tide-dominated delta forms when ocean tides are powerful and influence the shape of the delta. For example, Ganges-Brahmaputra Delta in the Bay of Bengal (near India and Bangladesh) is the world’s largest delta and mangrove swamp called the Sundarban [29].
At the Sundarban Delta in Bangladesh, tidal forces create linear intrusions of seawater into the delta. This delta also holds the world’s largest mangrove swamp.
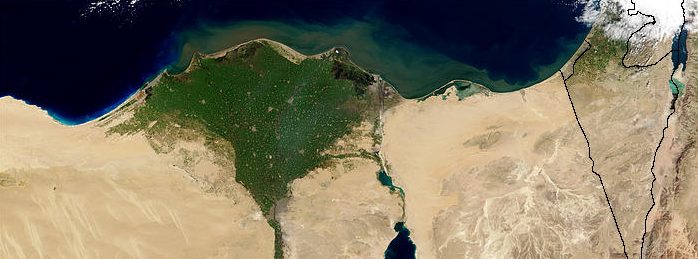
Lake Bonneville was a large, pluvial lake that occupied the western half of Utah and parts of eastern Nevada from about 30,000 to 12,000 years ago. The lake filled to a maximum elevation as great as approximately 5100 feet above mean sea level, filling the basins, leaving the mountains exposed, many as islands. The presence of the lake allowed for deposition of both fine grained lake mud and silt and coarse gravels from the mountains. Variations in lake level were controlled by regional climate and a catastrophic failure of Lake Bonneville’s main outlet, Red Rock Pass [31]. during extended periods of time in which the lake level remained stable, wave-cut terraces were produced that can be seen today on the flanks of many mountains in the region. Significant deltas formed at the mouths of major canyons in Salt Lake, Cache, and other Utah valleys. The Great Salt Lake is the remnant of Lake Bonneville and cities have built up on these delta deposits.
Stream terraces are remnants of older floodplains located above the existing floodplain and river. Like entrenched meanders, stream terraces form when uplift occurs or base level drops and streams erode downward, their meanders widening a new flood plain. Stream terraces can also form from extreme flood events associated with retreating glaciers. A classic example of multiple stream terraces are along the Snake River in Grand Teton National Park in Wyoming [32; 33].
 |
 |
Take this quiz to check your comprehension of this section.

11.6 Groundwater
Groundwater is an important source of freshwater. It can be found at varying depths in all places under the ground, but is limited by extractable quantity and quality.

11.6.1 Porosity and Permeability
An aquifer is a rock unit that contains extractable ground water. A good aquifer must be both porous and permeable. Porosity is the space between grains that can hold water, expressed as the percentage of open space in the total volume of the rock. Permeability comes from connectivity of the spaces that allows water to move in the aquifer. Porosity can occur as primary porosity, as space between sand grains or vesicles in volcanic rocks, or secondary porosity as fractures or dissolved spaces in rock). Compaction and cementation during lithification of sediments reduces porosity (see chapter 5.3).
A combination of a place to contain water (porosity) and the ability to move water (permeability) makes a good aquifer—a rock unit or sediment that allows extraction of groundwater. Well-sorted sediments have higher porosity because there are not smaller sediment particles filling in the spaces between the larger particles. Shales made of clays generally have high porosity, but the pores are poorly connected, thereby causing low permeability.

While permeability is an important measure of a porous material’s ability to transmit water, hydraulic conductivity is more commonly used by geologists to measure how easily a fluid is transmitted. Hydraulic conductivity measures both the permeability of the porous material and the properties of the water, or whatever fluid is being transmitted like oil or gas. Because hydraulic conductivity also measures the properties of the fluid, such as viscosity, it is used by both petroleum geologists and hydrogeologists to describe both the production capability of oil reservoirs and of aquifers. High hydraulic conductivity indicates that fluid transmits rapidly through an aquifer.
11.6.2 Aquifers
Aquifers are rock layers with sufficient porosity and permeability to allow water to be both contained and move within them. For rock or sediment to be considered an aquifer, its pores must be at least partially filled with water and it must be permeable enough to transmit water. Drinking water aquifers must also contain potable water. Aquifers can vary dramatically in scale, from spanning several formations covering large regions to being a local formation in a limited area. Aquifers adequate for water supply are both permeable, porous, and potable.
11.6.3 Groundwater Flow
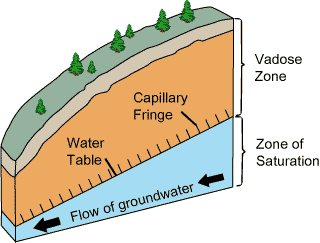
When surface water infiltrates or seeps into the ground, it usually enters the unsaturated zone also called the vadose zone, or zone of aeration. The vadose zone is the volume of geologic material between the land surface and the zone of saturation where the pore spaces are not completely filled with water [34]. Plant roots inhabit the upper vadose zone and fluid pressure in the pores is less than atmospheric pressure. Below the vadose zone is the capillary fringe. Capillary fringe is the usually thin zone below the vadose zone where the pores are completely filled with water (saturation), but the fluid pressure is less than atmospheric pressure. The pores in the capillary fringe are filled because of capillary action, which occurs because of a combination of adhesion and cohesion. Below the capillary fringe is the saturated zone or phreatic zone, where the pores are completely saturated and the fluid in the pores is at or above atmospheric pressure. The interface between the capillary fringe and the saturated zone marks the location of the water table.
Wells are conduits that extend into the ground with openings to the aquifers, to extract from, measure, and sometimes add water to the aquifer. Wells are generally the way that geologists and hydrologist measure the depth to groundwater from the land surface as well as withdraw water from aquifers.
Water is found throughout the pore spaces in sediments and bedrock. The water table is the area below which the pores are fully saturated with water. The simplest case of a water table is when the aquifer is unconfined, meaning it does not have a confining layer above it. Confining layers can pressurize aquifers by trapping water that is recharged at a higher elevation underneath the confining layer, allowing for a potentiometric surface higher than the top of the aquifer, and sometimes higher than the land surface.
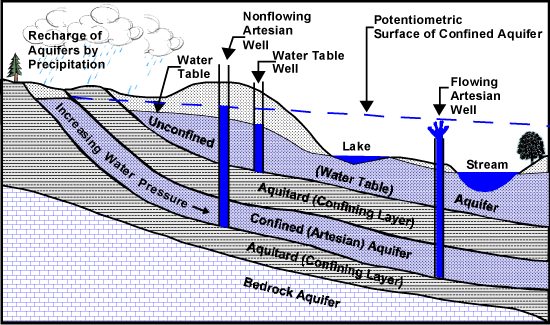
A confining layer is a low permeability layer above and/or below an aquifer that restricts the water from moving in and out of the aquifer. Confining layers include aquicludes, which are so impermeable that no water travels through them, and aquitards, which significantly decrease the speed at which water travels through them. The potentiometric surface represents the height that water would rise in a well penetrating the pressurized aquifer system. Breaches in the pressurized aquifer system, like faults or wells, can cause springs or flowing wells, also known as artesian wells.
The water table will generally mirror surface topography, though more subdued, because hydrostatic pressure is equal to atmospheric pressure along the surface of the water table. If the water table intersects the ground surface the result will be water at the surface in the form of a gaining stream, spring, lake, or wetland. The water table intersects the channel for gaining streams which then gains water from the water table. The channels for losing streams lie below the water table, thus losing streams lose water to the water table. Losing streams may be seasonal during a dry season or ephemeral in dry climates where they may normally be dry and carry water only after rain storms. Ephemeral streams pose a serious danger of flash flooding in dry climates.

Mentioned in the video is the USGS Groundwater Watch site.
Using wells, geologists measure the water table’s height and the potentiometric surface. Graphs of the depth to groundwater over time, are known as hydrographs and show changes in the water table over time. Well-water level is controlled by many factors and can change very frequently, even every minute, seasonally, and over longer periods of time.
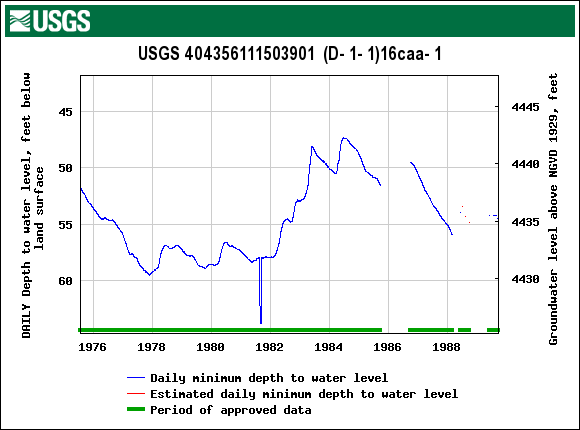
In 1856, French engineer Henry Darcy developed a hypothesis to show how discharge through a porous medium is controlled by permeability, pressure, and cross- sectional area. To prove this relationship, Darcy experimented with tubes of packed sediment with water running through them. The results of his experiments empirically established a quantitative measure of hydraulic conductivity and discharge that is known as Darcy’s law. The relationships described by Darcy’s Law have close similarities to Fourier's law in the field of heat conduction, Ohm's law in the field of electrical networks, or Fick's law in diffusion theory.
Q=KA(Δh/L)
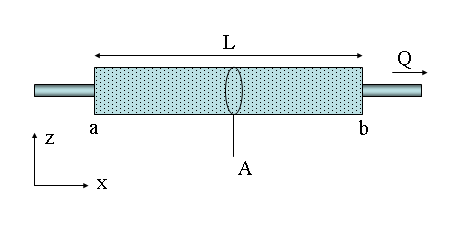
- Q = flow (volume/time)
- K = hydraulic conductivity (length/time)
- A = cross-sectional area of flow (area)
- Δh = change in pressure head (pressure difference)
- L = distance between pressure (h) measurements (length)
- Δh/L is commonly referred to as the hydraulic gradient
Pumping water from an unconfined aquifer lowers the water table. Pumping water from a confined aquifer lowers the pressure and/or potentiometric surface around the well. In an unconfined aquifer, the water table is lowered as water is removed from the aquifer near the well producing drawdown and a cone of depression (see figure). In a confined aquifer, pumping on an artesian well reduces the pressure or potentiometric surface around the well.
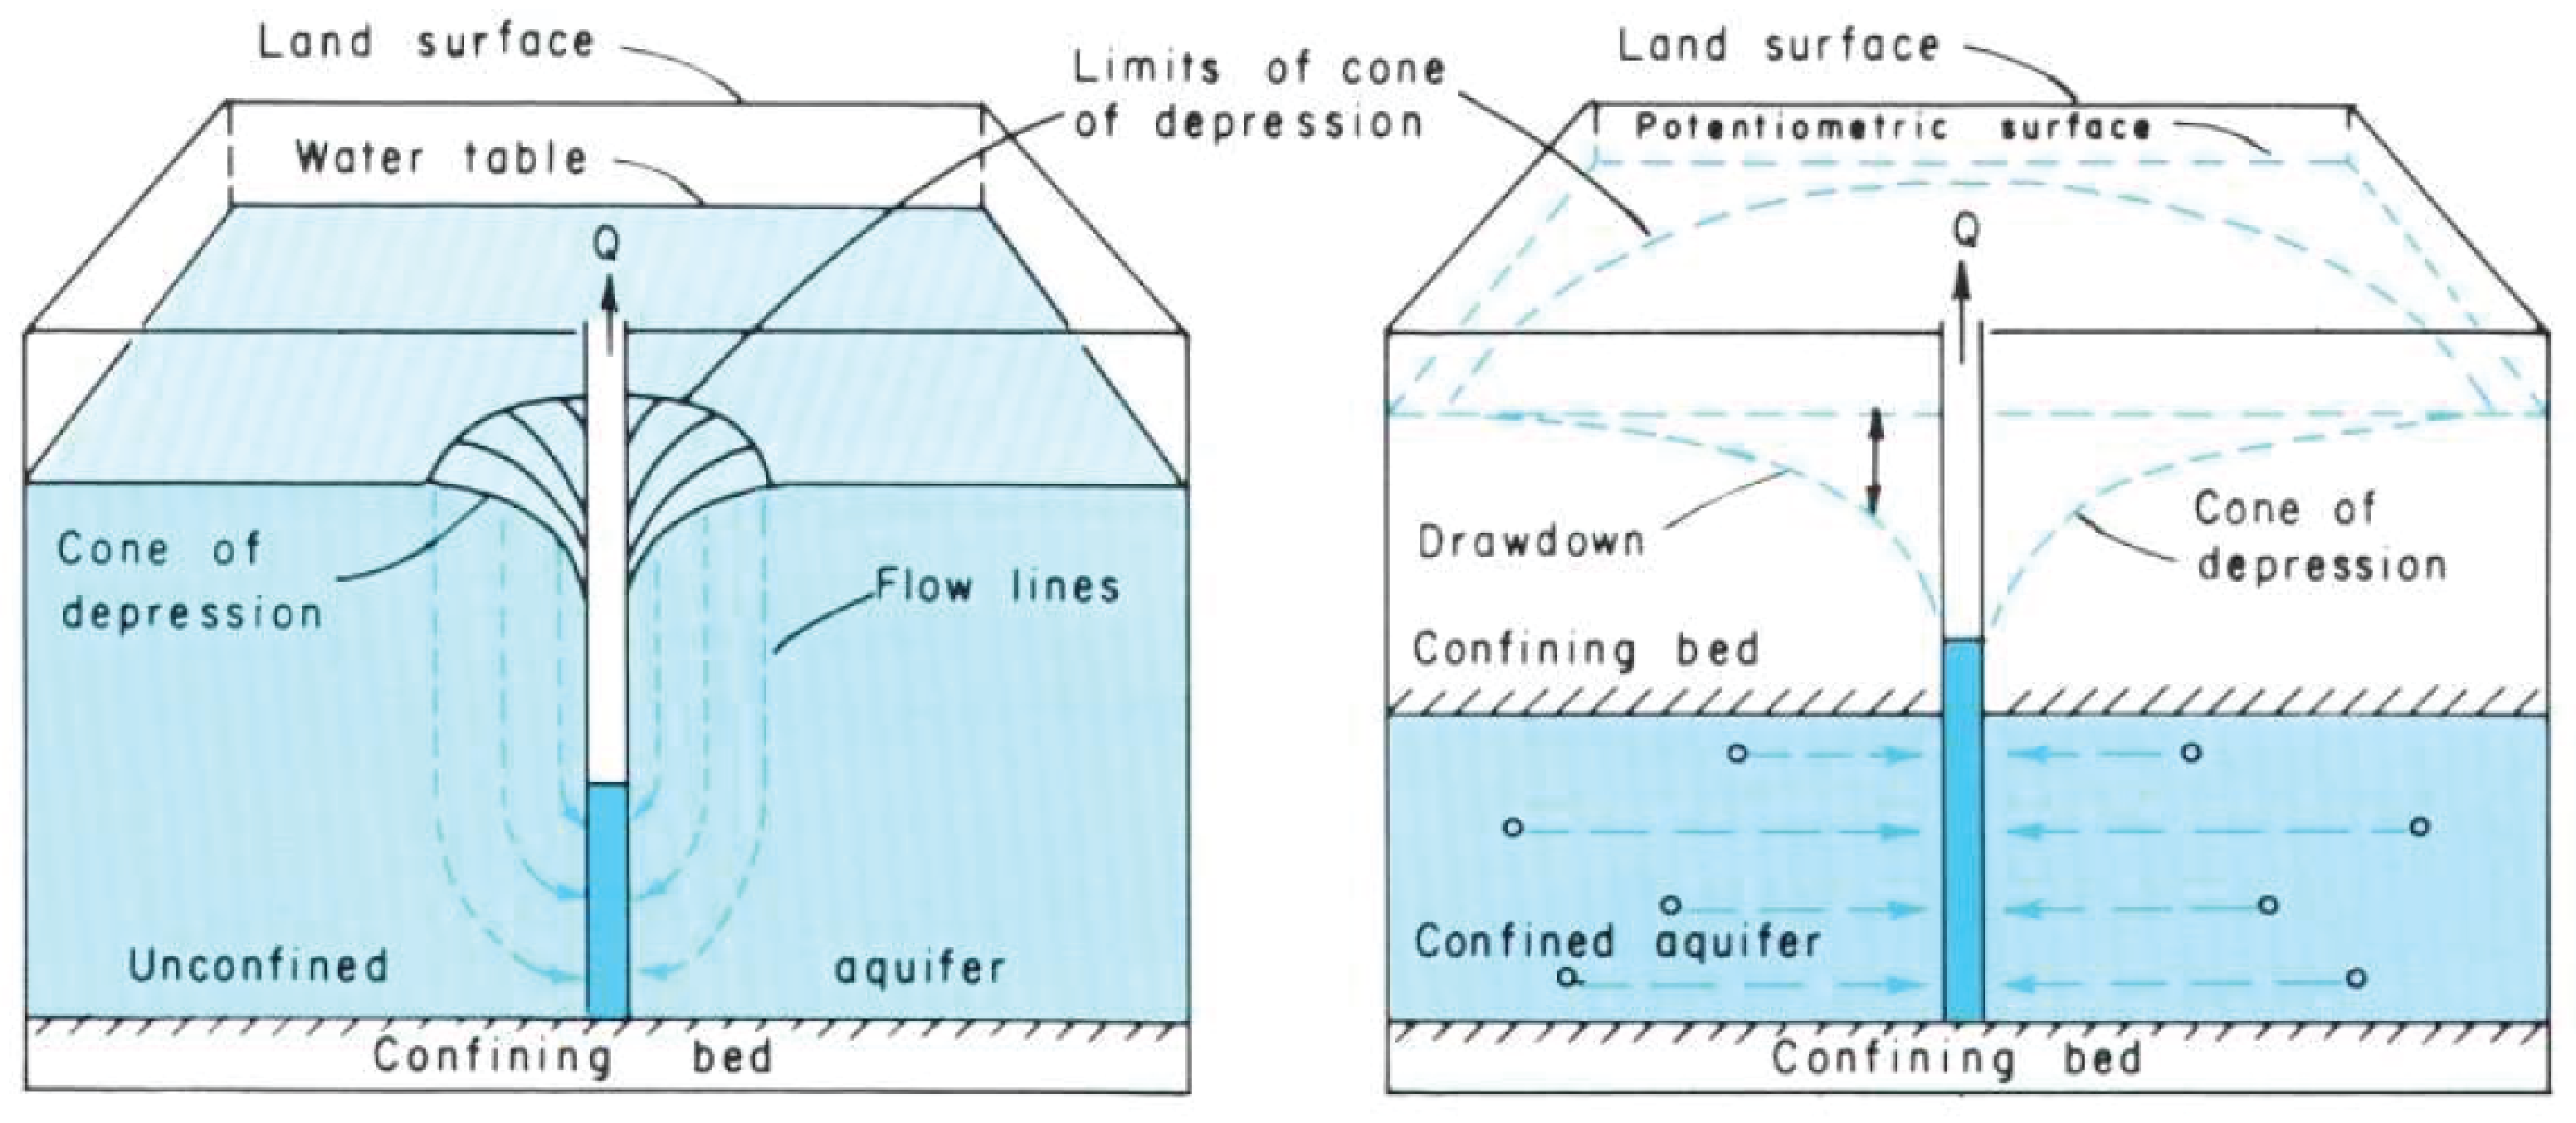
When one cone of depression intersects another cone of depression or a barrier feature like an impermeable mountain block, drawdown is intensified. When a cone of depression intersects a recharge zone, the cone of depression is lessened.
11.6.4 Recharge
The recharge area is where surface water enters an aquifer through the process of infiltration. Recharge areas are generally topographically high locations of an aquifer. They are characterized by losing streams and permeable rock that allows infiltration into the aquifer. Recharge areas mark the beginning of groundwater flow paths.
In the Basin and Range Province, recharge areas for the unconsolidated aquifers of the valleys are along mountain foothills. In the foothills of Salt Lake Valley, losing streams contribute water to the gravel-rich deltaic deposits of ancient Lake Bonneville, in some cases feeding artesian wells in the Salt Lake Valley.
An aquifer management practice is to induce recharge through storage and recovery. Geologists and hydrologists can increase the recharge rate into an aquifer system using injection wells and infiltration galleries or basins [35]. Injection wells pump water into an aquifer where it can be stored. Injection wells are regulated by state and federal governments to ensure that the injected water is not negatively impacting the quality or supply of the existing groundwater in the aquifer. Some aquifers can store significant quantities of water, allowing water managers to use the aquifer system like a surface reservoir. Water is stored in the aquifer during periods of low water demand and high water supply and later extracted during times of high water demand and low water supply.
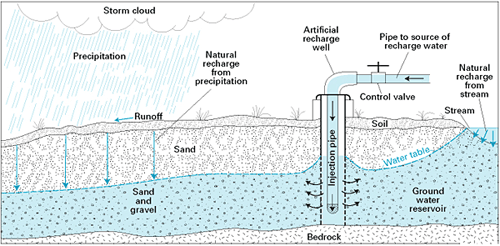
11.6.5 Discharge
Discharge areas are where the water table or potentiometric surface intersects the land surface. Discharge areas mark the end of groundwater flow paths. These areas are characterized by springs, flowing (artesian) wells, gaining streams, and playas in the dry valley basins of the Basin and Range Province of the western United States.
11.6.6 Groundwater mining and subsidence
Like other natural resources on our planet, the quantity of fresh and potable water is finite. The only natural source of water on land is from the sky in the form of precipitation. In many places, groundwater is being extracted faster than it is being replenished. When groundwater is extracted faster than it is recharged, groundwater levels and potentiometric surfaces decline, and discharge areas diminish or dry up completely. Regional pumping-induced groundwater decline is known as groundwater mining or groundwater overdraft. Groundwater mining is a serious situation and can lead to dry wells, reduced spring and stream flow, and subsidence. Groundwater mining is happening is places where more water is extracted by pumping than is being replenished by precipitation, and the water table is continually lowered. In these situations, groundwater must be viewed as a ore body and in its depletion, the possibility of producing ghost towns.

In many places, water actually helps hold up an aquifer’s skeleton by the water pressure exerted on the grains in an aquifer. This pressure is called pore pressure and comes from the weight of overlying water. If pore pressure decreases because of groundwater mining, the aquifer can compact, causing the surface of the ground to sink. Areas especially susceptible to this effect are aquifers made of unconsolidated sediments. Unconsolidated sediments with multiple layers of clay and other fine-grained material are at higher risk because when water is drained, clay compacts considerably [36; 37].
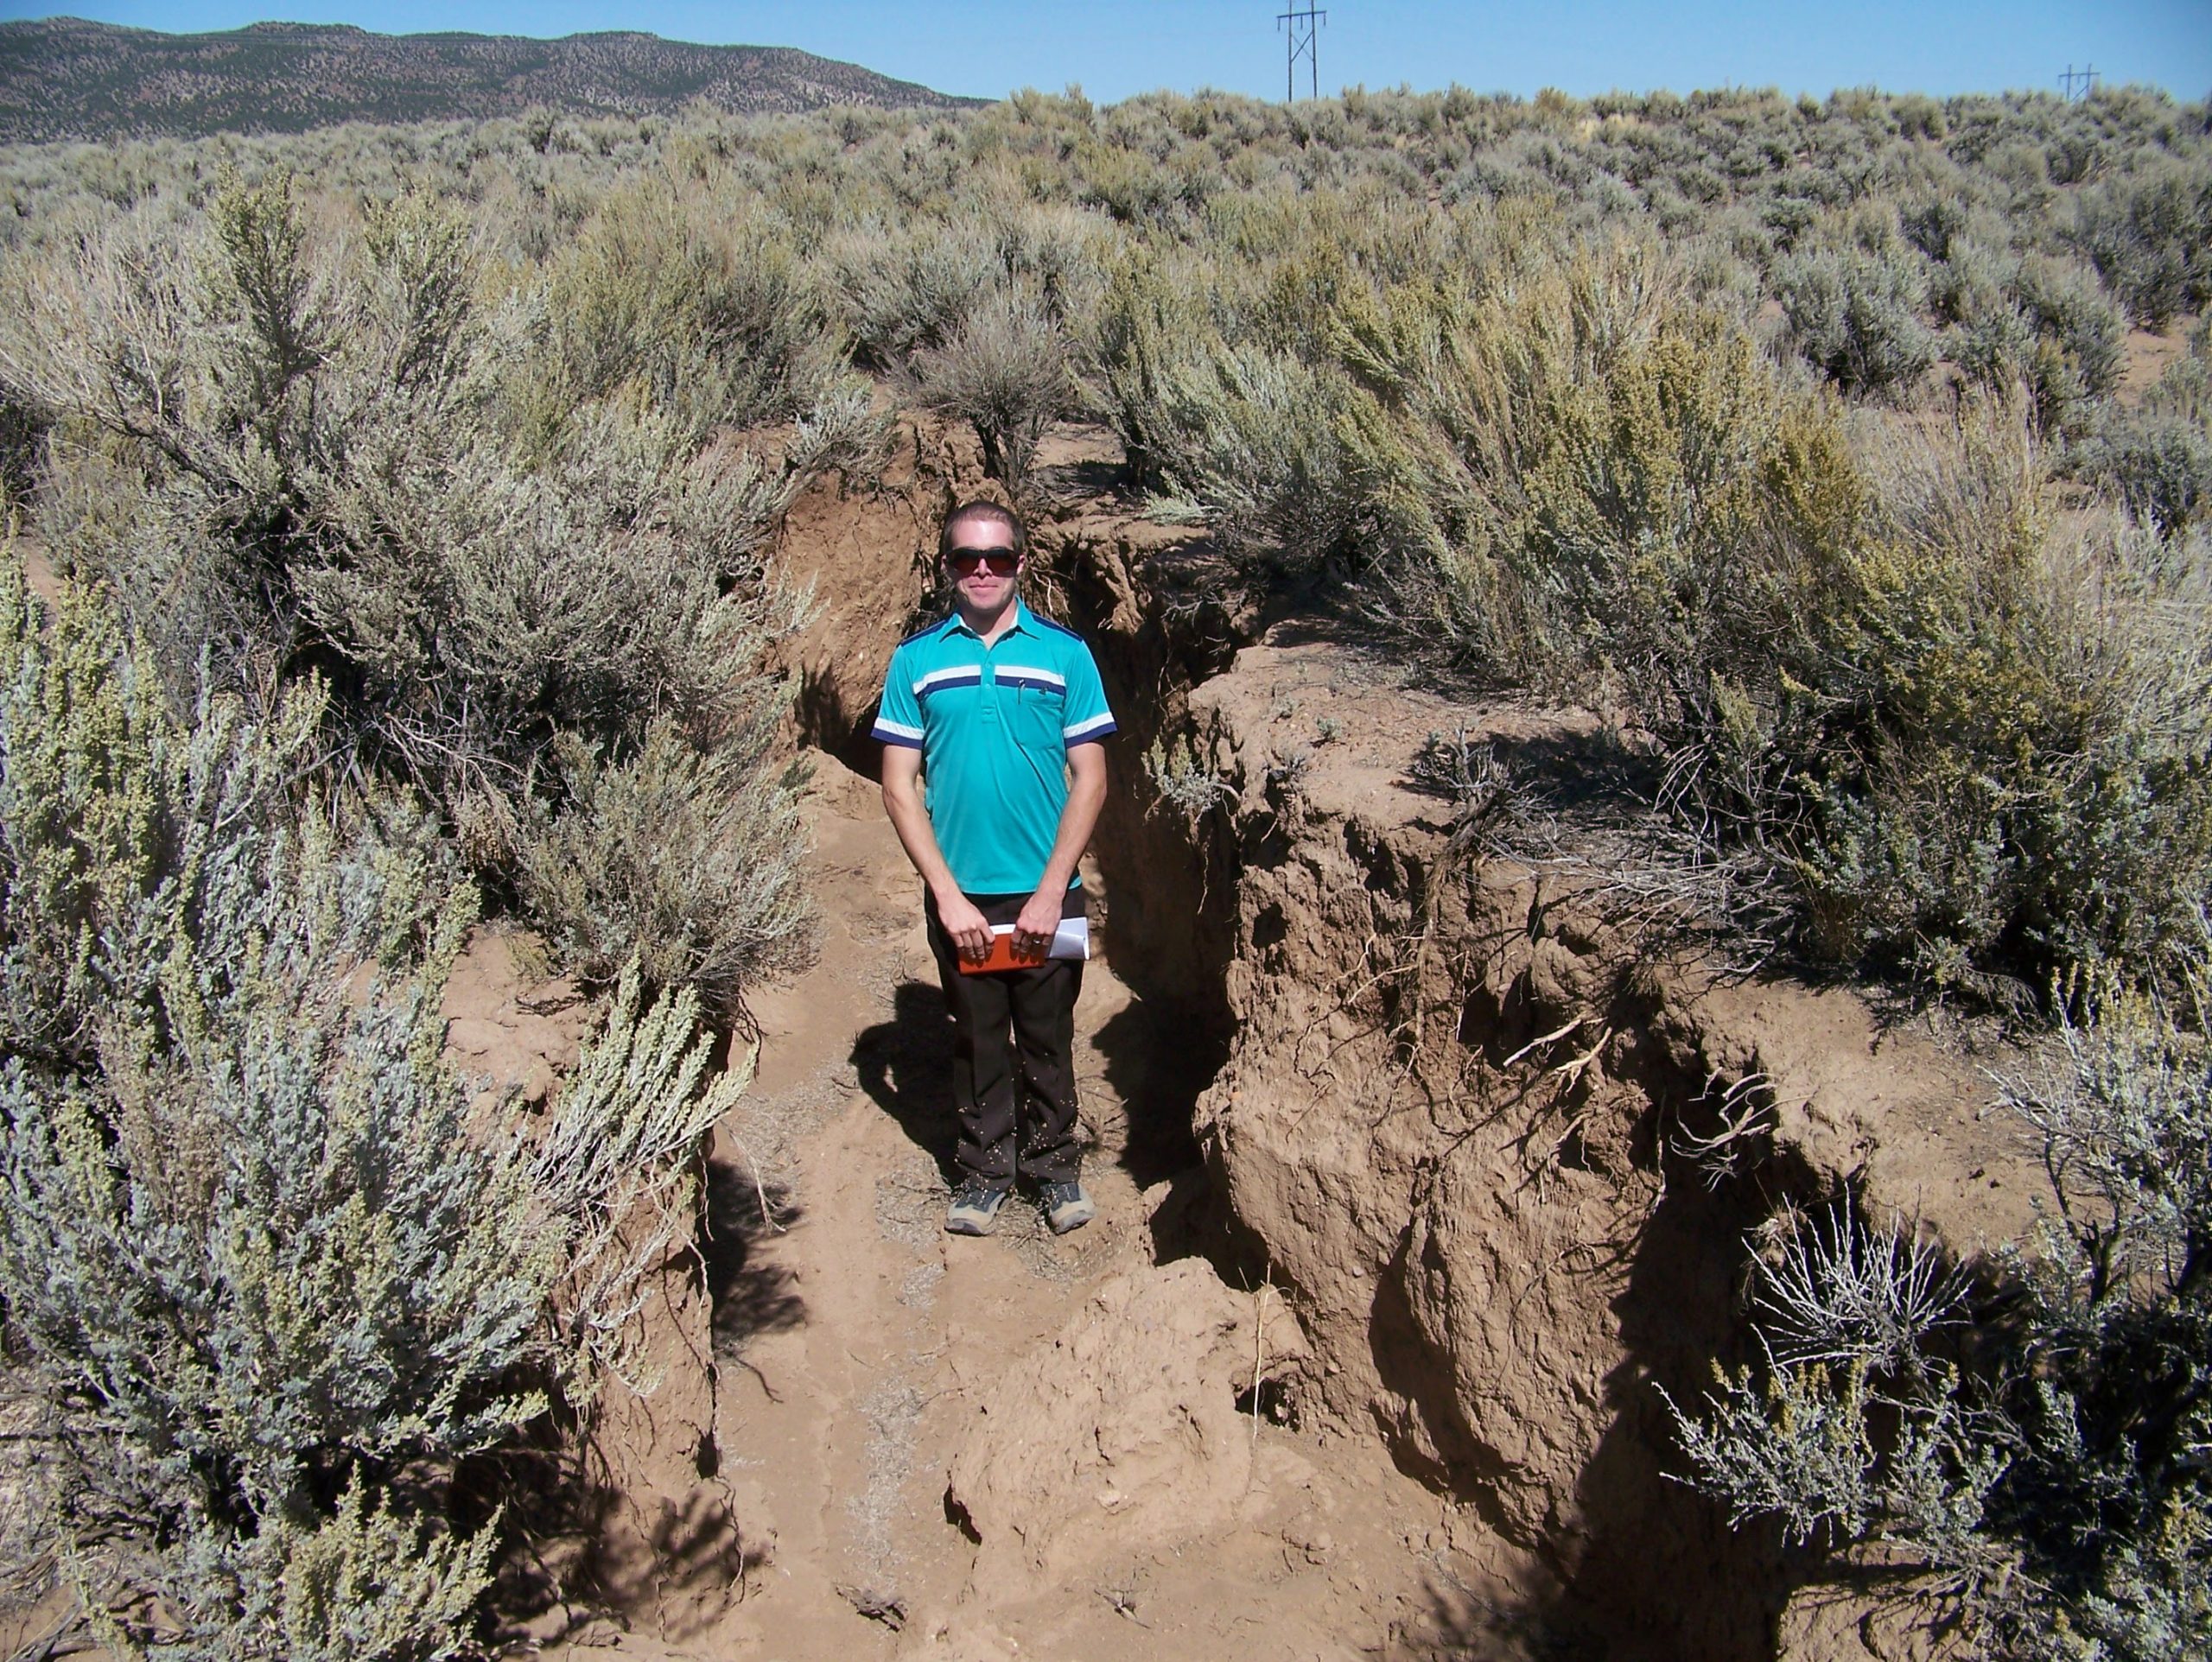
Subsidence from groundwater mining has been documented in southwestern Utah, notably Cedar Valley, Iron County, Utah. Groundwater levels have declined more than 100 feet in certain parts of Cedar Valley, causing earth fissures and measurable amounts of land subsidence.
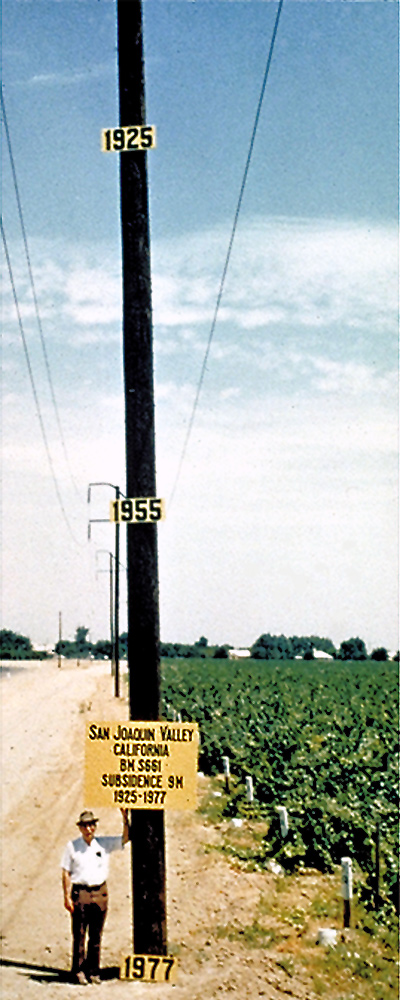
This photo shows documentation of subsidence from pumping of groundwater for irrigation in the Central Valley in California. The pole shows subsidence from groundwater pumping over a period of time.
Take this quiz to check your comprehension of this section.

11.7 Water Contamination and Remediation
Water can be contaminated by natural features like mineral-rich geologic formations and by human activities such as agriculture, industrial operations, landfills, animal operations, and sewage treatment processes, among many other things. As water runs over the land or infiltrates into the ground, it dissolves material left behind by these potential contaminant sources. There are three major groups of contamination: organic and inorganic chemicals and biological agents. Small sediments that cloud water, causing turbidity, is also an issue with some wells, but it is not considered contamination. The risks and type of remediation for a contaminant depends on the type of chemicals present.
Contamination occurs as point-source and nonpoint-source pollution. Point source pollution can be attributed to a single, definable source, while nonpoint source pollution is from multiple dispersed sources. Point sources include waste disposal sites, storage tanks, sewage treatment plants, and chemical spills. Nonpoint sources are dispersed and indiscreet, where the whole of the contribution of pollutants is harmful, but the individual components do not have harmful concentrations of pollutants. A good example of nonpoint pollution is residential areas, where lawn fertilizer on one person’s yard may not contribute much pollution to the system, but the combined effect of many residents using fertilizer can lead to significant nonpoint pollution. Other nonpoint sources include nutrients (nitrate and phosphate), herbicides, pesticides contributed by farming, nitrate contributed by animal operations, and nitrate contributed by septic systems.
Organic chemicals are common pollutants. They consist of strands and rings of carbon atoms, usually connected by covalent bonds. Other types of atoms, like chlorine, and molecules, like hydroxide (OH-), are attached to the strands and rings. The number and arrangement of atoms will decide how the chemical behaves in the environment, its danger to humans or ecosystems, and where the chemical ends up in the environment. The different arrangements of carbon allow for tens of thousands of organic chemicals, many of which have never been studied for negative effects on human health or the environment. Common organic pollutants are herbicides and pesticides, pharmaceuticals, fuel, and industrial solvents and cleansers.
Organic chemicals include surfactants such as cleaning agents and synthetic hormones associated with pharmaceuticals, which can act as endocrine disruptors. Endocrine disruptors mimic hormones, and can cause long-term effects in developing sexual reproduction systems in developing animals. Only very small quantities of endocrine disruptors are needed to cause significant changes in animal populations.
An example of organic chemical contamination is the Love Canal, Niagara Falls, New York. From 1942 to 1952, the Hooker Chemical Company disposed of over 21,337 mt (21,000 t) of chemical waste, including chlorinated hydrocarbons, into a canal and covered it with a thin layer of clay. Chlorinated hydrocarbons are a large group of organic chemicals that have chlorine functional groups, most of which are toxic and carcinogenic to humans. The company sold the land to the New York School Board, who developed it into a neighborhood. After residents began to suffer from serious health ailments and pools of oily fluid started rising into residents’ basements, the neighborhood had to be evacuated. This site became a U.S. Environmental Protection Agency Superfund site, a site with federal funding and oversight to ensure its cleanup.
Inorganic chemicals are another set of chemical pollutants. They can contain carbon atoms, but not in long strands or links. Inorganic contaminants include chloride, arsenic, and nitrate (NO3). Nutrients can be from geologic material, like phosphorous-rich rock, but are most often sourced from fertilizer and animal and human waste. Untreated sewage and agricultural runoff contain concentrates of nitrogen and phosphorus which are essential for the growth of microorganisms. Nutrients like nitrate and phosphate in surface water can promote growth of microbes, like blue-green algae (cyanobacteria), which in turn use oxygen and create toxins (microcystins and anatoxins) in lakes [38]. This process is known as eutrophication.
Metals are common inorganic contaminants. Lead, mercury, and arsenic are some of the more problematic inorganic groundwater contaminants. Bangladesh has a well documented case of arsenic contamination from natural geologic material dissolving into the groundwater. Acid-mine drainage can also cause significant inorganic contamination (see Chapter 16).
Salt, typically sodium chloride, is a common inorganic contaminant. It can be introduced into groundwater from natural sources, such as evaporite deposits like the Arapien Shale of Utah, or from anthropogenic sources like the salts applied to roads in the winter to keep ice from forming. Salt contamination can also occur near ocean coasts from saltwater intruding into the cones of depression around fresh groundwater pumping, inducing the encroachment of saltwater into the freshwater body.
Biological agents are another common groundwater contaminant which includes harmful bacteria and viruses. A common bacteria contaminant is Escherichia coli (E. coli). Generally, harmful bacteria are not present in groundwater unless the groundwater source is closely connected with a contaminated surface source, such as a septic system. Karst, landforms created from dissolved limestone, is especially susceptible to this form of contamination, because water moves relatively quickly through the conduits of dissolved limestone. Bacteria can also be used for remediation.
Table. Groundwater contaminants.
Remediation is the act of cleaning contamination. Hydrologists use three types of remediation: biological, chemical, and physical. Biological remediation uses specific strains of bacteria to break down a contaminant into safer chemicals. This type of remediation is usually used on organic chemicals, but also works on reducing or oxidizing inorganic chemicals like nitrate. Phytoremediation is a type of bioremediation that uses plants to absorb the chemicals over time.
Chemical remediation uses chemicals to remove the contaminant or make it less harmful. One example is to use a reactive barrier, a permeable wall in the ground or at a discharge point that chemically reacts with contaminants in the water. Reactive barriers made of limestone can increase the pH of acid mine drainage, making the water less acidic and more basic, which removes dissolved contaminants by precipitation into solid form.
Physical remediation consists of removing the contaminated water and either treating it with filtration, called pump-and-treat, or disposing of it. All of these options are technically complex, expensive, and difficult, with physical remediation typically being the most costly.
Take this quiz to check your comprehension of this section.

11.8 Karst
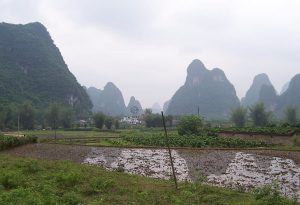
Karst refers to landscapes and hydrologic features created by the dissolving of limestone. Karst can be found anywhere there is limestone and other soluble subterranean substances like salt deposits. Dissolving of limestone creates features like sinkholes, caverns, disappearing streams, and towers.
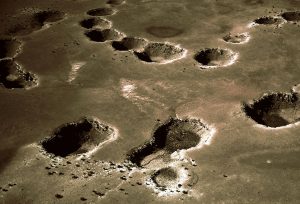
Dissolving of underlying salt deposits has caused sinkholes to form in the Kaibab Limestone on the Colorado Plateau in Arizona.
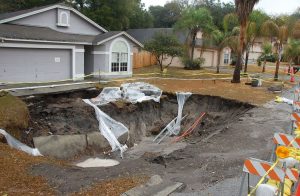
Collapse of the surface into an underground cavern caused this sinkhole in the front yard of a home in Florida.
CO2 in the atmosphere dissolves readily in the water droplets that form clouds from which precipitation comes in the form of rain and snow. This precipitation is slightly acidic with carbonic acid. Karst forms when carbonic acid dissolves calcite (calcium carbonate) in limestone.
H2O + CO2 = H2CO3
Water + Carbon Dioxide Gas equals Carbonic Acid in Water
CaCO3 + H2CO3 = Ca2++ 2HCO3 -1
Solid Calcite + Carbonic Acid in Water Dissolved equals Calcium Ion + Dissolved Bicarbonate Ion
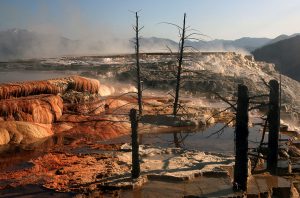
After the slightly acidic water dissolves the calcite, changes in temperature or gas content in the water can cause the water to redeposit the calcite in a different place as tufa (travertine), often deposited by a spring or in a cave. Speleothems are secondary deposits, typically made of travertine, deposited in a cave. Travertine speleothems form by water dripping through cracks and dissolved openings in caves and evaporating, leaving behind the travertine deposits. Speleothems commonly occur in the form of stalactites, when extending from the ceiling, and stalagmites, when standing up from the floor.
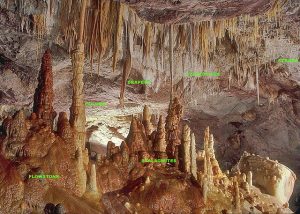
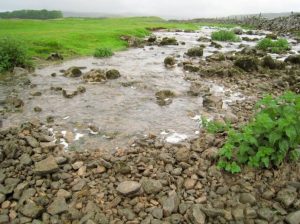
Surface water enters the karst system through sinkholes, losing streams, and disappearing streams. Changes in base level can cause rivers running over limestone to dissolve the limestone and sink into the ground. As the water continues to dissolve its way through the limestone, it can leave behind intricate networks of caves and narrow passages. Often dissolution will follow and expand fractures in the limestone. Water exits the karst system as springs and rises. In mountainous terrane, dissolution can extend all the way through the vertical profile of the mountain, with caverns dropping thousands of feet.
Take this quiz to check your comprehension of this section.

Summary
Water is essential for all living things. It continuously cycles through the atmosphere, over land, and through the ground. In much of the United States and other countries, water is managed through a system of regional laws and regulations and distributed on paper in a system collectively known as “water rights”. Surface water follows a watershed, which is separate from other areas by its divides (highest ridges). Groundwater exists in the pores within rocks and sediment. It moves predominantly due to pressure and gravitational gradients through the rock. Human and natural causes can make water unsuitable for consumption. There are different ways to deal with this contamination. Karst is when limestone is dissolved by water, forming caves and sinkholes.
Take this quiz to check your comprehension of this Chapter.

References
- Brush, L.M., Jr, 1961, Drainage basins, channels, and flow characteristics of selected streams in central Pennsylvania: pubs.er.usgs.gov.
- Charlton, R., 2007, Fundamentals of fluvial geomorphology: Taylor & Francis.
- Cirrus Ecological Solutions, 2009, Jordan River TMDL: Utah State Division of Water Quality.
- Earle, S., 2015, Physical geology OER textbook: BC Campus OpenEd.
- EPA, 2009, Water on Tap-What You Need to Know: U.S. Environmental Protection Agency.
- Fagan, B., 2012, Elixir: A history of water and humankind: Bloomsbury Press.
- Fairbridge, R.W., 1968, Yazoo rivers or streams, in Geomorphology: Springer Berlin Heidelberg Encyclopedia of Earth Science, p. 1238–1239.
- Freeze, A.R., and Cherry, J.A., 1979, Groundwater: Prentice Hall.
- Galloway, D., Jones, D.R., and Ingebritsen, S.E., 1999, Land subsidence in the United States: U.S. Geological Survey Circular 1182.
- Galloway, W.E., Whiteaker, T.L., and Ganey-Curry, P., 2011, History of Cenozoic North American drainage basin evolution, sediment yield, and accumulation in the Gulf of Mexico basin: Geosphere, v. 7, no. 4, p. 938–973.
- Gilbert, G.K., 1890, Lake Bonneville: United States Geological Survey, 438 p.
- Gleick, P.H., 1993, Water in Crisis: A Guide to the World’s Fresh Water Resources: Oxford University Press.
- Hadley, G., 1735, Concerning the cause of the general trade-winds: By Geo. Hadley, Esq; FRS: Philosophical Transactions, v. 39, no. 436–444, p. 58–62.
- Halvorson, S.F., and James Steenburgh, W., 1999, Climatology of lake-effect snowstorms of the Great Salt Lake: University of Utah.
- Heath, R.C., 1983, Basic ground-water hydrology: U.S. Geological Survey Water-Supply Paper 2220, 91 p.
- Hobbs, W.H., and Fisk, H.N., 1947, Geological Investigation of the Alluvial Valley of the Lower Mississippi River: JSTOR.
- Knudsen, T., Inkenbrandt, P., Lund, W., Lowe, M., and Bowman, S., 2014, Investigation of land subsidence and earth fissures in Cedar Valley, Iron County, Utah: Utah Geological Survey Special Study 150.
- Lorenz, E.N., 1955, Available potential energy and the maintenance of the general circulation: Tell’Us, v. 7, no. 2, p. 157–167.
- Marston, R.A., Mills, J.D., Wrazien, D.R., Bassett, B., and Splinter, D.K., 2005, Effects of Jackson lake dam on the Snake River and its floodplain, Grand Teton National Park, Wyoming, USA: Geomorphology, v. 71, no. 1–2, p. 79–98.
- Maupin, M.A., Kenny, J.F., Hutson, S.S., Lovelace, J.K., Barber, N.L., and Linsey, K.S., 2014, Estimated use of water in the United States in 2010: US Geological Survey.
- Myers, W.B., and Hamilton, W., 1964, The Hebgen Lake, Montana, earthquake of August 17, 1959: U.S. Geol. Surv. Prof. Pap., v. 435, p. 51.
- Oviatt, C.G., 2015, Chronology of Lake Bonneville, 30,000 to 10,000 yr B.P: Quat. Sci. Rev., v. 110, p. 166–171.
- Powell, J.W., 1879, Report on the lands of the arid region of the United States with a more detailed account of the land of Utah with maps: Monograph.
- Reed, J.C., Love, D., and Pierce, K., 2003, Creation of the Teton landscape: a geologic chronicle of Jackson Hole and the Teton Range: pubs.er.usgs.gov.
- Reese, R.S., 2014, Review of Aquifer Storage and Recovery in the Floridan Aquifer System of Southern Florida:
- Schele, L., Miller, M.E., Kerr, J., Coe, M.D., and Sano, E.J., 1992, The Blood of Kings: Dynasty and Ritual in Maya Art: George Braziller Inc.
- Seaber, P.R., Kapinos, F.P., and Knapp, G.L., 1987, Hydrologic unit maps:
- Solomon, S., 2011, Water: The Epic Struggle for Wealth, Power, and Civilization: Harper Perennial.
- Törnqvist, T.E., Wallace, D.J., Storms, J.E.A., Wallinga, J., Van Dam, R.L., Blaauw, M., Derksen, M.S., Klerks, C.J.W., Meijneken, C., and Snijders, E.M.A., 2008, Mississippi Delta subsidence primarily caused by compaction of Holocene strata: Nat. Geosci., v. 1, no. 3, p. 173–176.
- Turner, R.E., and Rabalais, N.N., 1991, Changes in Mississippi River water quality this century: Bioscience, v. 41, no. 3, p. 140–147.
- United States Geological Survey, 1967, The Amazon: Measuring a Mighty River: United States Geological Survey O-245-247.
- U.S. Environmental Protection Agency, 2014, Cyanobacteria/Cyanotoxins
- U.S. Geological Survey, 2012, Snowmelt - The Water Cycle, from USGS Water-Science School
- Utah/Nevada Draft Snake Valley Agreement, 2013
Heath, R. C. (1983). Basic ground-water hydrology (No. Water-Supply Paper 2220). [Washington, D.C.]; Alexandria, Va.: U.S. Geological Survey. Retrieved from http://pubs.usgs.gov/wsp/2220/report.pdf
A depression in dune sediment formed because of a lack of anchoring vegetation.
Carbonate rock that reacts with hot magmatic fluids, creating concentrated ore deposits, which include copper, iron, zinc, and gold.
Isolated piece of bedrock which sticks above an alluvial surface.
Metallic mineral deposit which forms near mid-ocean ridges.
A rule that says the outer valence shell of electrons is complete when it contains 8 electrons.
Metallic mineral deposit consisting of mafic plutonic rocks, typically containing platinum-group elements, chromium, copper, nickel, etc.
Dunes that form semicircular shapes due to anchoring vegetation.
Chemical sedimentary rocks that have a biologic component to their origin. Many limestones are biochemical.
[glossary]
Sedimentary rocks made of mineral grains weathered as mechanical detritus of previous rocks, e.g. sand, gravel, etc.
Dangerous flooding that occurs in arid regions.
Area behind the arc, which can be subject to compressional (causing thrusted mountain belts) or extensional (causing back-arc basins) forces.
A chain of volcanic activity, typically in a curved pattern, rising from a subduction zone. The arc is on the overriding plate, typically a few hundred kilometers from the trench, but parallel to the trench.
A sedimentary structure that has inclined layers within an overall layer. Forms commonly in dunes, larger in eolian dunes.
A vast stretch of sand dunes.
Crescent-shaped dune formed by consistent wind and limited sediment.
The process that turns non-desert land into desert.
Series of lakes between moraines within an alpine glacier basin, typically a cirque.
Dunes that form from many different wind directions.
Term for the extensional tectonic province that extends from California's Sierra Nevada Mountains in the west, to Utah's Wasatch Mountains to the east, to southern Oregon and Idaho to the north, to northern Mexico to the south. Known as a wide rift, as each graben 'basin,' bounded by horst 'ranges.' Each set of horsts with a graben has some individual extension, adding up to the overall rifting.
Name given to the subducting plate, where volatiles are driven out at depth, causing volcanism.
A body of ice that moves downhill under its own mass.
An alpine glacier that fills a mountain valley.
Thick glaciers that cover continents during ice ages.
Snow which has been compressed, and is starting to turn into ice.
Cracks that form with glacial movement in the upper, brittle part of the glacier.
The net gain or loss of ice within a glacier.
Rocks which allow petroleum resources to collect or move.
Part of a glacier which has a net loss of material over the course of a year.
Ridge of sediment that forms under a glacier by meltwater which forms a river.
A ridge that is carved between two glacial valleys.
Glacially-carved, bowl-shaped valley.
Possesses properties of both acid and base
Steep spire carved by several glaciers.
A feature formed by a tributary glacier going into a main glacier, forming a tributary valley floor higher in elevation than the main valley floor.
Low point within an arête.
An eroded arête that forms a triangular shape.
A place where two or more glaciers combine, and the lateral moraines combine to form a moraine within the glacier.
Large sediment (e.g. boulder) carried and then dropped by a glacier.
QR Code generated with QRCode Monkey. All generated QR Codes are 100% free and can be used for whatever you want. This includes all commercial purposes.
Photo by Foto Chd (german wikipedia, https://de.wikipedia.org/wiki/Benutzer:Chd), used under the terms of the GNU Free Documentation License
Accumulation of sediment at the margins of glaciers, including the base, sides, and end.
By Zkeizars (Own work) [GFDL or CC BY-SA 4.0-3.0-2.5-2.0-1.0], via Wikimedia Commons
Moraine that forms at the end of a glacier.
A terminal moraine that forms as a glacier melts.
Dunes that are much longer than wide, forming from wind that varies in two opposite directions.
This is a copyrighted image from the CAMECA Archives
Reproduction is authorized, under the terms of the GNU Free Documentation License.
A rock made of primarily silt.
Accumulation of fine-grained sediment formed downhill of the terminal moraine.
Depression formed by ice resting in sediment, then preserved after the ice melts and the sediment lithifies.
Lake that forms in a kettle.
Lake that fills a glacial valley.
The study of rock layers and their relationships to each other within a specific area.
Ridge of sediment that forms under a glacier, with a steep uphill (with respect to the glacier) side and gentle downhill side.
A period of cooler temperatures on Earth in which ice sheets can grow on continents.
Lakes that form via increased precipitation with glacial climate shifts.
A system which reverts back to a baseline when it deviates.
A property of a solid, such that when a force is applied, the solid flows, stretches, or bends along with the force, instead of cracking or breaking. For example, many plastics are ductile.
A series of changes to the Earth's orbit which can fluctuate climate.
Wobbles in the Earth's axis.
The angle of the Earth's axis with respect to the plane of rotation.
Water that flows over the surface.
Any downhill movement of material, caused by gravity.
Rob Lavinsky, iRocks.com – CC-BY-SA-3.0 [CC BY-SA 3.0], via Wikimedia Commons
Mix of sediments that form as a subducting plate descends and the overriding plate scrapes material and material is added.
QR Code generated with QRCode Monkey. All generated QR Codes are 100% free and can be used for whatever you want. This includes all commercial purposes.
Relative balance of an object based on how it floats.
When a species no longer exists.
Current conditions within the atmosphere.
Long term averages and variations within the conditions of the atmosphere.
A dark liquid fossil fuel derived from petroleum.
QR Code generated with QRCode Monkey. All generated QR Codes are 100% free and can be used for whatever you want. This includes all commercial purposes.
Soil and rock which is below freezing for long periods of time.
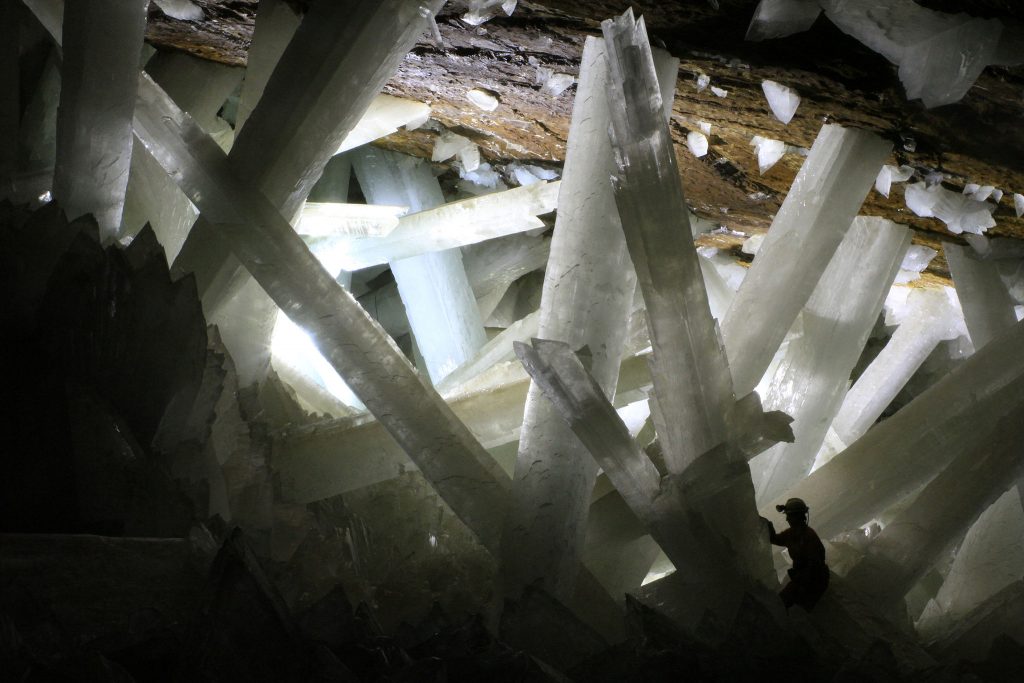
3 Minerals
KEY CONCEPTS
At the end of this chapter, students should be able to:
- Define mineral.
- Describe the basic structure of the atom.
- Derive basic atomic information from the Periodic Table of Elements.
- Describe chemical bonding related to minerals.
- Describe the main ways minerals form.
- Describe the silicon-oxygen tetrahedron and how it forms common silicate minerals.
- List common non-silicate minerals in oxide, sulfide, sulfate, and carbonate groups.
- Identify minerals using physical properties and identification tables.
The term “minerals” as used in nutrition labels and pharmaceutical products is not the same as a mineral in a geological sense. In geology, the classic definition of a mineral is: 1) naturally occurring, 2) inorganic, 3) solid at room temperature, 4) regular crystal structure, and 5) defined chemical composition. Some natural substances technically should not be considered minerals, but are included by exception. For example, water and mercury are liquid at room temperature. Both are considered minerals because they were classified before the room-temperature rule was accepted as part of the definition. Calcite is quite often formed by organic processes, but is considered a mineral because it is widely found and geologically important. Because of these discrepancies, the International Mineralogical Association in 1985 amended the definition to: “A mineral is an element or chemical compound that is normally crystalline and that has been formed as a result of geological processes.” This means that the calcite in the shell of a clam is not considered a mineral. But once that clam shell undergoes burial, diagenesis, or other geological processes, then the calcite is considered a mineral. Typically, substances like coal, pearl, opal, or obsidian that do not fit the definition of mineral are called mineraloids.
A rock is a substance that contains one or more minerals or mineraloids. As is discussed in later chapters, there are three types of rocks composed of minerals: igneous (rocks crystallizing from molten material), sedimentary (rocks composed of products of mechanical weathering (sand, gravel, etc.) and chemical weathering (things precipitated from solution), and metamorphic (rocks produced by alteration of other rocks by heat and pressure.
3.1 Chemistry of Minerals
Rocks are composed of minerals that have a specific chemical composition. To understand mineral chemistry, it is essential to examine the fundamental unit of all matter, the atom.
3.1.1 The Atom
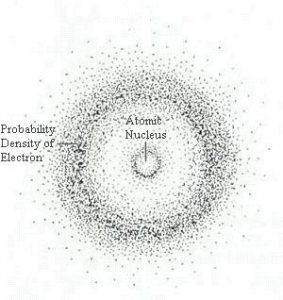
Matter is made of atoms. Atoms consists of subatomic particles—protons, neutrons, and electrons. A simple model of the atom has a central nucleus composed of protons, which have positive charges, and neutrons which have no charge. A cloud of negatively charged electrons surrounds the nucleus, the number of electrons equaling the number of protons thus balancing the positive charge of the protons for a neutral atom. Protons and neutrons each have a mass number of 1. The mass of an electron is less than 1/1000th that of a proton or neutron, meaning most of the atom’s mass is in the nucleus.
3.1.2 Periodic Table of the Elements
Matter is composed of elements which are atoms that have a specific number of protons in the nucleus. This number of protons is called the Atomic Number for the element. For example, an oxygen atom has 8 protons and an iron atom has 26 protons. An element cannot be broken down chemically into a simpler form and retains unique chemical and physical properties. Each element behaves in a unique manner in nature. This uniqueness led scientists to develop a periodic table of the elements, a tabular arrangement of all known elements listed in order of their atomic number.
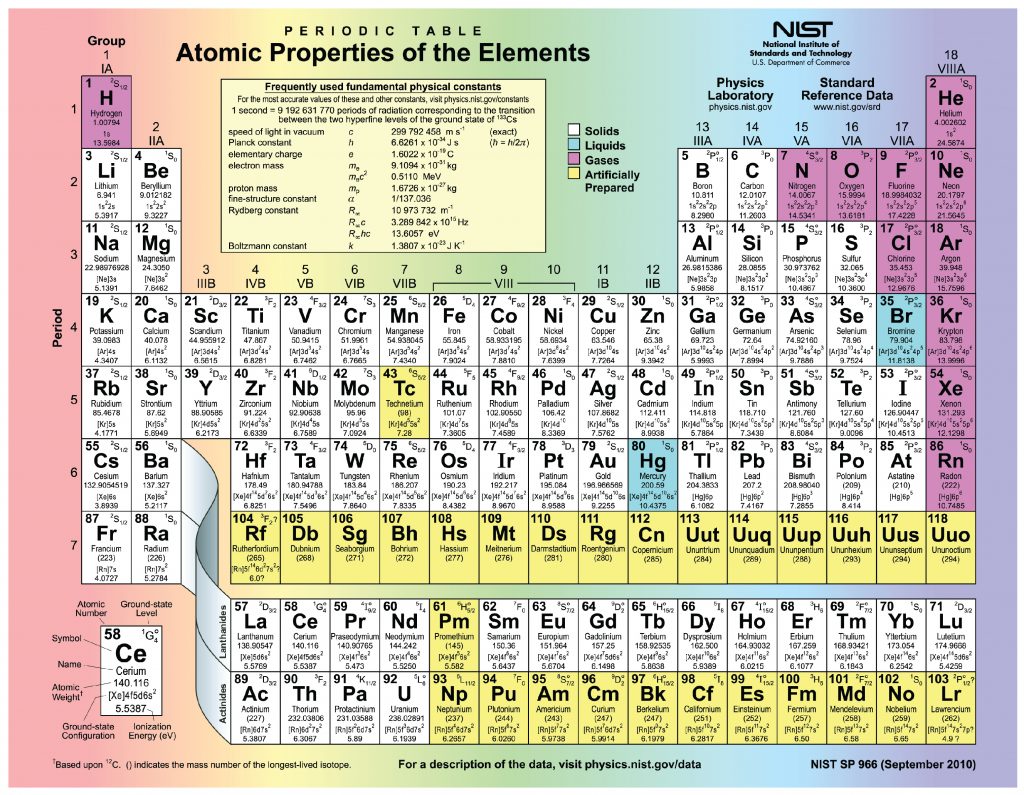
The first arrangement of elements into a periodic table was done by Dmitri Mendeleev in 1869 using the elements known at the time. In the periodic table, each element has a chemical symbol, name, atomic number, and atomic mass. The chemical symbol is an abbreviation for the element, often derived from a Latin or Greek name for the substance. The atomic number is the number of protons in the nucleus. The atomic mass is the number of protons and neutrons in the nucleus, each with a mass number of one. Since the mass of electrons is so much less than the protons and neutrons, the atomic mass is effectively the number of protons plus neutrons.
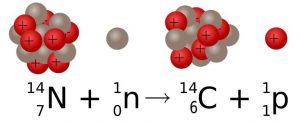
The atomic mass of natural elements represents an average mass of the atoms comprising that substance in nature and is usually not a whole number as seen on the periodic table, meaning that an element exists in nature with atoms having different numbers of neutrons. The differing number of neutrons affects the mass of an element in nature and the atomic mass number represents this average. This gives rise to the concept of isotope. Isotopes are forms of an element with the same number of protons but different numbers of neutrons. There are usually several isotopes for a particular element. For example, 98.9% of carbon atoms have 6 protons and 6 neutrons. This isotope of carbon is called carbon-12 (12C). A few carbon atoms, carbon-13 (13C), have 6 protons and 7 neutrons. A trace amount of carbon atoms, carbon-14 (14C), has 6 protons and 8 neutrons.
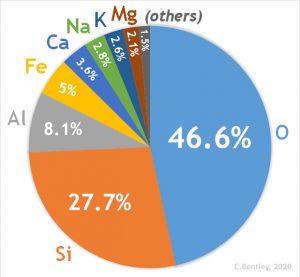
Among the 118 known elements, the heaviest are fleeting human creations known only in high energy particle accelerators, and they decay rapidly. The heaviest naturally occurring element is uranium, atomic number 92. The eight most abundant elements in Earth’s continental crust are shown in Table 1. These elements are found in the most common rock forming minerals.
| Element | Symbol | Abundance % |
| Oxygen | O | 47% |
| Silicon | Si | 28% |
| Aluminum | Al | 8% |
| Iron | Fe | 5% |
| Calcium | Ca | 4% |
| Sodium | Na | 3% |
| Potassium | K | 3% |
| Magnesium | Mg | 2% |
Table 1. Eight Most Abundant Elements in the Earth’s Continental Crust % by weight (source: USGS). All other elements are less than 1%.
3.1.3 Chemical Bonding

Most substances on Earth are compounds containing multiple elements. Chemical bonding describes how these atoms attach with each other to form compounds, such as sodium and chlorine combining to form NaCl, common table salt. Compounds that are held together by chemical bonds are called molecules. Water is a compound of hydrogen and oxygen in which two hydrogen atoms are covalently bonded with one oxygen making the water molecule. The oxygen we breathe is formed when one oxygen atom covalently bonds with another oxygen atom to make the molecule O2. The subscript 2 in the chemical formula indicates the molecule contains two atoms of oxygen.
Most minerals are also compounds of more than one element. The common mineral calcite has the chemical formula CaCO3 indicating the molecule consists of one calcium, one carbon, and three oxygen atoms. In calcite, one carbon and three oxygen atoms are held together by covalent bonds to form a molecular ion, called carbonate, which has a negative charge. Calcium as an ion has a positive charge of plus two. The two oppositely charged ions attract each other and combine to form the mineral calcite, CaCO3. The name of the chemical compound is calcium carbonate, where calcium is Ca and carbonate refers to the molecular ion CO3-2.
The mineral olivine has the chemical formula (Mg,Fe)2SiO4, in which one silicon and four oxygen atoms are bonded with two atoms of either magnesium or iron. The comma between iron (Fe) and magnesium (Mg) indicates the two elements can occupy the same location in the crystal structure and substitute for one another.
3.1.3.1 Valence and Charge
The electrons around the atom’s nucleus are located in shells representing different energy levels. The outermost shell is called the valence shell. Electrons in the valence shell are involved in chemical bonding. In 1913, Niels Bohr proposed a simple model of the atom that states atoms are more stable when their outermost shell is full. Atoms of most elements thus tend to gain or lose electrons so the outermost or valence shell is full. In Bohr’s model, the innermost shell can have a maximum of two electrons and the second and third shells can have a maximum of eight electrons. When the innermost shell is the valence shell, as in the case of hydrogen and helium, it obeys the octet rule when it is full with two electrons. For elements in higher rows, the octet rule of eight electrons in the valence shell applies.
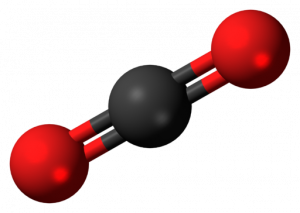
The rows in the periodic table present the elements in order of atomic number and the columns organize elements with similar characteristics, such as the same number of electrons in their valence shells. Columns are often labeled from left to right with Roman numerals I to VIII, and Arabic numerals 1 through 18. The elements in columns I and II have 1 and 2 electrons in their respective valence shells and the elements in columns VI and VII have 6 and 7 electrons in their respective valence shells.
In row 3 and column I, sodium (Na) has 11 protons in the nucleus and 11 electrons in three shells—2 electrons in the inner shell, 8 electrons in the second shell, and 1 electron in the valence shell. To maintain a full outer shell of 8 electrons per the octet rule, sodium readily gives up that 1 electron so there are 10 total electrons. With 11 positively charged protons in the nucleus and 10 negatively charged electrons in two shells, sodium when forming chemical bonds is an ion with an overall net charge of +1.
All elements in column I have a single electron in their valence shell and a valence of 1. These other column I elements also readily give up this single valence electron and thus become ions with a +1 charge. Elements in column II readily give up 2 electrons and end up as ions with a charge of +2. Note that elements in columns I and II which readily give up their valence electrons, often form bonds with elements in columns VI and VII which readily take up these electrons. Elements in columns 3 through 15 are usually involved in covalent bonding. The last column 18 (VIII) contains the noble gases. These elements are chemically inert because the valence shell is already full with 8 electrons, so they do not gain or lose electrons. An example is the noble gas helium which has 2 valence electrons in the first shell. Its valence shell is therefore full. All elements in column VIII possess full valence shells and do not form bonds with other elements.
As seen above, an atom with a net positive or negative charge as a result of gaining or losing electrons is called an ion. In general the elements on the left side of the table lose electrons and become positive ions, called cations because they are attracted to the cathode in an electrical device. The elements on the right side tend to gain electrons. These are called anions because they are attracted to the anode in an electrical device. The elements in the center of the periodic table, columns 3 through 15, do not consistently follow the octet rule. These are called transition elements. A common example is iron, which has a +2 or +3 charge depending on the oxidation state of the element. Oxidized Fe+3 carries a +3 charge and reduced Fe+2 is +2. These two different oxidation states of iron often impart dramatic colors to rocks containing their minerals—the oxidized form producing red colors and the reduced form producing green.
3.1.3.2 Ionic Bonding
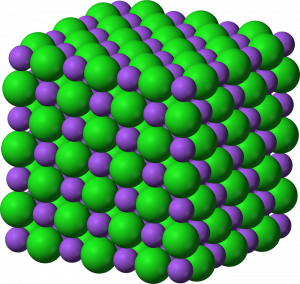
Ionic bonds, also called electron-transfer bonds, are formed by the electrostatic attraction between atoms having opposite charges. Atoms of two opposite charges attract each other electrostatically and form an ionic bond in which the positive ion transfers its electron (or electrons) to the negative ion which takes them up. Through this transfer both atoms thus achieve a full valence shell. For example one atom of sodium (Na+1) and one atom of chlorine (Cl-1) form an ionic bond to make the compound sodium chloride (NaCl). This is also known as the mineral halite or common table salt. Another example is calcium (Ca+2) and chlorine (Cl-1) combining to make the compound calcium chloride (CaCl2). The subscript 2 indicates two atoms of chlorine are ionically bonded to one atom of calcium.
3.1.3.3 Covalent Bonding
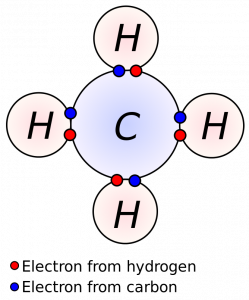
Ionic bonds are usually formed between a metal and a nonmetal. Another type, called a covalent or electron-sharing bond, commonly occurs between nonmetals. Covalent bonds share electrons between ions to complete their valence shells. For example, oxygen (atomic number 8) has 8 electrons—2 in the inner shell and 6 in the valence shell. Gases like oxygen often form diatomic molecules by sharing valence electrons. In the case of oxygen, two atoms attach to each other and share 2 electrons to fill their valence shells to become the common oxygen molecule we breathe (O2). Methane (CH4) is another covalently bonded gas. The carbon atom needs 4 electrons and each hydrogen needs 1. Each hydrogen shares its electron with the carbon to form a molecule as shown in the figure.
Take this quiz to check your comprehension of this section.

3.2 Formation of Minerals
Minerals form when atoms bond together in a crystalline arrangement. Three main ways this occurs in nature are: 1) precipitation directly from an aqueous (water) solution with a temperature change, 2) crystallization from a magma with a temperature change, and 3) biological precipitation by the action of organisms.
3.2.1 Precipitation from aqueous solution

Solutions consist of ions or molecules, known as solutes, dissolved in a medium or solvent. In nature this solvent is usually water. Many minerals can be dissolved in water, such as halite or table salt, which has the composition sodium chloride, NaCl. The Na+1 and Cl-1 ions separate and disperse into the solution.
Precipitation is the reverse process, in which ions in solution come together to form solid minerals. Precipitation is dependent on the concentration of ions in solution and other factors such as temperature and pressure. The point at which a solvent cannot hold any more solute is called saturation. Precipitation can occur when the temperature of the solution falls, when the solute evaporates, or with changing chemical conditions in the solution. An example of precipitation in our homes is when water evaporates and leaves behind a rind of minerals on faucets, shower heads, and drinking glasses.
In nature, changes in environmental conditions may cause the minerals dissolved in water to form bonds and grow into crystals or cement grains of sediment together. In Utah, deposits of tufa formed from mineral-rich springs that emerged into the ice age Lake Bonneville. Now exposed in dry valleys, this porous tufa was a natural insulation used by pioneers to build their homes with a natural protection against summer heat and winter cold. The travertine terraces at Mammoth Hot Springs in Yellowstone Park are another example formed by calcite precipitation at the edges of the shallow spring-fed ponds.
Another example of precipitation occurs in the Great Salt Lake, Utah, where the concentration of sodium chloride and other salts is nearly eight times greater than in the world’s oceans [zotpressInText item="{DU5CMSHJ}" format="%num%" brackets="yes"]. Streams carry salt ions into the lake from the surrounding mountains. With no other outlet, the water in the lake evaporates and the concentration of salt increases until saturation is reached and the minerals precipitate out as sediments. Similar salt deposits include halite and other precipitates, and occur in other lakes like Mono Lake in California and the Dead Sea.
3.2.2 Crystallization from Magma
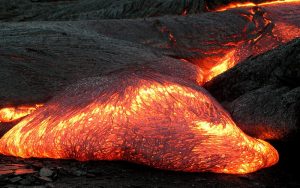
Heat is energy that causes atoms in substances to vibrate. Temperature is a measure of the intensity of the vibration. If the vibrations are violent enough, chemical bonds are broken and the crystals melt releasing the ions into the melt. Magma is molten rock with freely moving ions. When magma is emplaced at depth or extruded onto the surface (then called lava), it starts to cool and mineral crystals can form.
3.2.3 Precipitation by Organisms
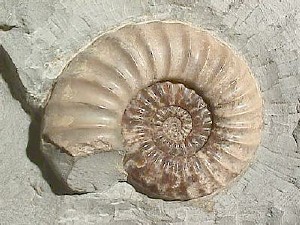
Many organisms build bones, shells, and body coverings by extracting ions from water and precipitating minerals biologically. The most common mineral precipitated by organisms is calcite, or calcium carbonate (CaCO3). Calcite is often precipitated by organisms as a polymorph called aragonite. Polymorphs are crystals with the same chemical formula but different crystal structures. Marine invertebrates such as corals and clams precipitate aragonite or calcite for their shells and structures. Upon death, their hard parts accumulate on the ocean floor as sediments, and eventually may become the sedimentary rock limestone. Though limestone can form inorganically, the vast majority is formed by this biological process. Another example is marine organisms called radiolaria, which are zooplankton that precipitate silica for their microscopic external shells. When the organisms die, the shells accumulate on the ocean floor and can form the sedimentary rock chert. An example of biologic precipitation from the vertebrate world is bone, which is composed mostly of a type of apatite, a mineral in the phosphate group. The apatite found in bones contains calcium and water in its structure and is called hydroxycarbonate apatite, Ca5(PO4)3(OH). As mentioned above, such substances are not technically minerals until the organism dies and these hard parts become fossils.
Take this quiz to check your comprehension of this section.

3.3 Silicate Minerals
Minerals are categorized based on their composition and structure. Silicate minerals are built around a molecular ion called the silicon-oxygen tetrahedron. A tetrahedron has a pyramid-like shape with four sides and four corners. Silicate minerals form the largest group of minerals on Earth, comprising the vast majority of the Earth’s mantle and crust. Of the nearly four thousand known minerals on Earth, most are rare. There are only a few that make up most of the rocks likely to be encountered by surface dwelling creatures like us. These are generally called the rock-forming minerals.

The silicon-oxygen tetrahedron (SiO4) consists of a single silicon atom at the center and four oxygen atoms located at the four corners of the tetrahedron. Each oxygen ion has a -2 charge and the silicon ion has a +4 charge. The silicon ion shares one of its four valence electrons with each of the four oxygen ions in a covalent bond to create a symmetrical geometric four-sided pyramid figure. Only half of the oxygen’s valence electrons are shared, giving the silicon-oxygen tetrahedron an ionic charge of -4. This silicon-oxygen tetrahedron forms bonds with many other combinations of ions to form the large group of silicate minerals.
The silicon ion is much smaller than the oxygen ions (see the figures) and fits into a small space in the center of the four large oxygen ions, seen if the top ball is removed (as shown in the figure to the right). Because only one of the valence electrons of the corner oxygens is shared, the silicon-oxygen tetrahedron has chemically active corners available to form bonds with other silica tetrahedra or other positively charged ions such as Al+3, Fe+2,+3, Mg+2, K+1, Na+1, and Ca+2. Depending on many factors, such as the original magma chemistry, silica-oxygen tetrahedra can combine with other tetrahedra in several different configurations. For example, tetrahedra can be isolated, attached in chains, sheets, or three dimensional structures. These combinations and others create the chemical structure in which positively charged ions can be inserted for unique chemical compositions forming silicate mineral groups.
3.3.1 The dark ferromagnesian silicates
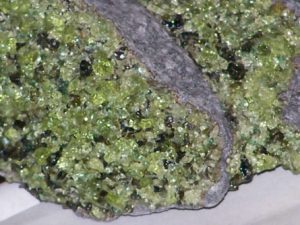
The Olivine Family
Olivine is the primary mineral component in mantle rock such as peridotite and basalt. It is characteristically green when not weathered. The chemical formula is (Fe,Mg)2SiO4. As previously described, the comma between iron (Fe) and magnesium (Mg) indicates these two elements occur in a solid solution. Not to be confused with a liquid solution, a solid solution occurs when two or more elements have similar properties and can freely substitute for each other in the same location in the crystal structure.
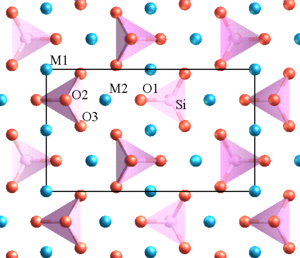
Olivine is referred to as a mineral family because of the ability of iron and magnesium to substitute for each other. Iron and magnesium in the olivine family indicates a solid solution forming a compositional series within the mineral group which can form crystals of all iron as one end member and all mixtures of iron and magnesium in between to all magnesium at the other end member. Different mineral names are applied to compositions between these end members. In the olivine series of minerals, the iron and magnesium ions in the solid solution are about the same size and charge, so either atom can fit into the same location in the growing crystals. Within the cooling magma, the mineral crystals continue to grow until they solidify into igneous rock. The relative amounts of iron and magnesium in the parent magma determine which minerals in the series form. Other rarer elements with similar properties to iron or magnesium, like manganese (Mn), can substitute into the olivine crystalline structure in small amounts. Such ionic substitutions in mineral crystals give rise to the great variety of minerals and are often responsible for differences in color and other properties within a group or family of minerals. Olivine has a pure iron end-member (called fayalite) and a pure magnesium end-member (called forsterite). Chemically, olivine is mostly silica, iron, and magnesium and therefore is grouped among the dark-colored ferromagnesian (iron=ferro, magnesium=magnesian) or mafic minerals, a contraction of their chemical symbols Ma and Fe. Mafic minerals are also referred to as dark-colored ferromagnesian minerals. Ferro means iron and magnesian refers to magnesium. Ferromagnesian silicates tend to be more dense than non-ferromagnesian silicates. This difference in density ends up being important in controlling the behavior of the igneous rocks that are built from these minerals: whether a tectonic plate subducts or not is largely governed by the density of its rocks, which are in turn controlled by the density of the minerals that comprise them.
The crystal structure of olivine is built from independent silica tetrahedra. Minerals with independent tetrahedral structures are called neosilicates (or orthosilicates). In addition to olivine, other common neosilicate minerals include garnet, topaz, kyanite, and zircon.
Two other similar arrangements of tetrahedra are close in structure to the neosilicates and grade toward the next group of minerals, the pyroxenes. In a variation on independent tetrahedra called sorosilicates, there are minerals that share one oxygen between two tetrahedra, and include minerals like pistachio-green epidote, a gemstone. Another variation are the cyclosilicates, which as the name suggests, consist of tetrahedral rings, and include gemstones such as beryl, emerald, aquamarine, and tourmaline
3.3.2 Pyroxene Family
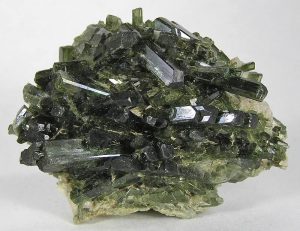

Pyroxene is another family of dark ferromagnesian minerals, typically black or dark green in color. Members of the pyroxene family have a complex chemical composition that includes iron, magnesium, aluminum, and other elements bonded to polymerized silica tetrahedra. Polymers are chains, sheets, or three-dimensional structures, and are formed by multiple tetrahedra covalently bonded via their corner oxygen atoms. Pyroxenes are commonly found in mafic igneous rocks such as peridotite, basalt, and gabbro, as well as metamorphic rocks like eclogite and blue schist.
Pyroxenes are built from long, single chains of polymerized silica tetrahedra in which tetrahedra share two corner oxygens. The silica chains are bonded together into the crystal structures by metal cations. A common member of the pyroxene family is augite, itself containing several solid solution series with a complex chemical formula (Ca,Na)(Mg,Fe,Al,Ti)(Si,Al)2O6 that gives rise to a number of individual mineral names.
This single-chain crystalline structure bonds with many elements, which can also freely substitute for each other. The generalized chemical composition for pyroxene is XZ(Al,Si)2O6. X represents the ions Na, Ca, Mg, or Fe, and Z represents Mg, Fe, or Al. These ions have similar ionic sizes, which allows many possible substitutions among them. Although the cations may freely substitute for each other in the crystal, they carry different ionic charges that must be balanced out in the final crystalline structure. For example Na has a charge of +1, but Ca has charge of +2. If a Na+ ion substitutes for a Ca+2 ion, it creates an unequal charge that must be balanced by other ionic substitutions elsewhere in the crystal. Note that ionic size is more important than ionic charge for substitutions to occur in solid solution series in crystals.
3.3.3 Amphibole Family
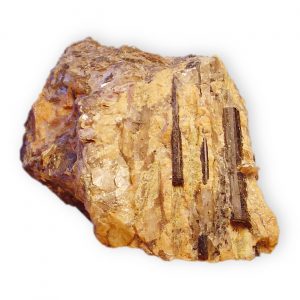
Amphibole minerals are built from polymerized double silica chains and they are also referred to as inosilicates. Imagine two pyroxene chains that connect together by sharing a third oxygen on each tetrahedra. Amphiboles are usually found in igneous and metamorphic rocks and typically have a long-bladed crystal habit. The most common amphibole, hornblende, is usually black; however, they come in a variety of colors depending on their chemical composition. The metamorphic rock, amphibolite, is primarily composed of amphibole minerals.

Amphiboles are composed of iron, magnesium, aluminum, and other cations bonded with silica tetrahedra. These dark ferromagnesian minerals are commonly found in gabbro, baslt, diorite, and often form the black specks in granite. Their chemical formula is very complex and generally written as (RSi4O11)2, where R represents many different cations. For example, it can also be written more exactly as AX2Z5((Si,Al,Ti)8O22)(OH,F,Cl,O)2. In this formula A may be Ca, Na, K, Pb, or blank; X equals Li, Na, Mg, Fe, Mn, or Ca; and Z is Li, Na, Mg, Fe, Mn, Zn, Co, Ni, Al, Cr, Mn, V, Ti, or Zr. The substitutions create a wide variety of colors such as green, black, colorless, white, yellow, blue, or brown. Amphibole crystals can also include hydroxide ions (OH-), which occurs from an interaction between the growing minerals and water dissolved in magma.
3.3.4 Sheet Silicates
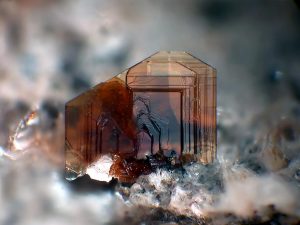
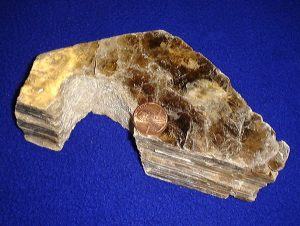
Sheet silicates are built from tetrahedra which share all three of their bottom corner oxygens thus forming sheets of tetrahedra with their top corners available for bonding with other atoms. Micas and clays are common types of sheet silicates, also known as phyllosilicates. Mica minerals are usually found in igneous and metamorphic rocks, while clay minerals are more often found in sedimentary rocks. Two frequently found micas are dark-colored biotite, frequently found in granite, and light-colored muscovite, found in the metamorphic rock called schist.
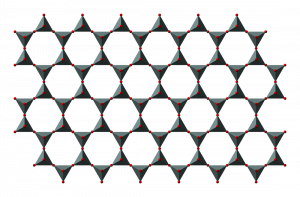
Chemically, sheet silicates usually contain silicon and oxygen in a 2:5 ratio (Si4O10). Micas contain mostly silica, aluminum, and potassium. Biotite mica has more iron and magnesium and is considered a ferromagnesian silicate mineral. Muscovite micas belong to the felsic silicate minerals. Felsic is a contraction formed from feldspar, the dominant mineral in felsic rocks.
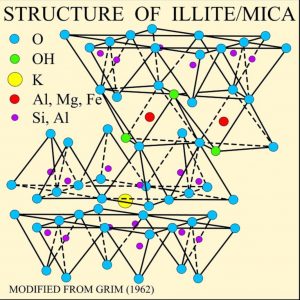
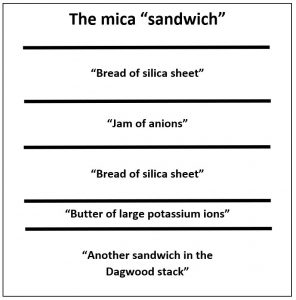
The illustration of the crystalline structure of mica shows the corner O atoms bonded with K, Al, Mg, Fe, and Si atoms, forming polymerized sheets of linked tetrahedra, with an octahedral layer of Fe, Mg, or Al, between them. The yellow potassium ions form Van der Waals bonds (attraction and repulsion between atoms, molecules, and surfaces) and hold the sheets together. Van der Waals bonds differ from covalent and ionic bonds, and exist here between the sandwiches, holding them together into a stack of sandwiches. The Van der Waals bonds are weak compared to the bonds within the sheets, allowing the sandwiches to be separated along the potassium layers. This gives mica its characteristic property of easily cleaving into sheets.
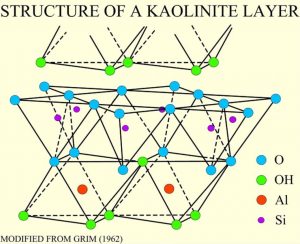
Clays minerals occur in sediments formed by the weathering of rocks and are another family of silicate minerals with a tetrahedral sheet structure. Clay minerals form a complex family, and are an important component of many sedimentary rocks. Other sheet silicates include serpentine and chlorite, found in metamorphic rocks.
Clay minerals are composed of hydrous aluminum silicates. One type of clay, kaolinite, has a structure like an open-faced sandwich, with the bread being a single layer of silicon-oxygen tetrahedra and a layer of aluminum as the spread in an octahedral configuration with the top oxygens of the sheets.
3.3.5 Framework Silicates
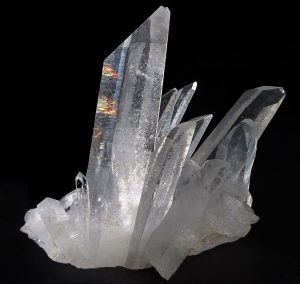
Quartz and feldspar are the two most abundant minerals in the continental crust. In fact, feldspar itself is the single most abundant mineral in the Earth’s crust. There are two types of feldspar, one containing potassium and abundant in felsic rocks of the continental crust, and the other with sodium and calcium abundant in the mafic rocks of oceanic crust. Together with quartz, these minerals are classified as framework silicates. They are built with a three-dimensional framework of silica tetrahedra in which all four corner oxygens are shared with adjacent tetrahedra. Within these frameworks in feldspar are holes and spaces into which other ions like aluminum, potassium, sodium, and calcium can fit giving rise to a variety of mineral compositions and mineral names.
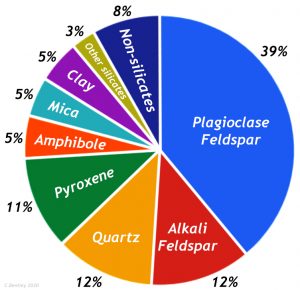
Feldspars are usually found in igneous rocks, such as granite, rhyolite, and basalt as well as metamorphic rocks and detrital sedimentary rocks. Detrital sedimentary rocks are composed of mechanically weathered rock particles, like sand and gravel. Quartz is especially abundant in detrital sedimentary rocks because it is very resistant to disintegration by weathering. While quartz is the most abundant mineral on the Earth's surface, due to its durability, the feldspar minerals are the most abundant minerals in the Earth's crust, comprising roughly 50% of the total minerals that make up the crust.
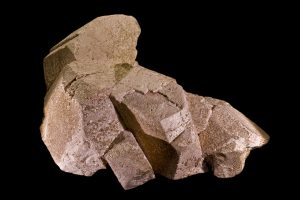
Quartz is composed of pure silica, SiO2, with the tetrahedra arranged in a three dimensional framework. Impurities consisting of atoms within this framework give rise to many varieties of quartz among which are gemstones like amethyst, rose quartz, and citrine. Feldspars are mostly silica with aluminum, potassium, sodium, and calcium. Orthoclase feldspar (KAlSi3O8), also called potassium feldspar or K-spar, is made of silica, aluminum, and potassium. Quartz and orthoclase feldspar are felsic minerals. Felsic is the compositional term applied to continental igneous minerals and rocks that contain an abundance of silica. Another feldspar is plagioclase with the formula (Ca,Na)AlSi3O8, the solid solution (Ca,Na) indicating a series of minerals, one end of the series with calcium CaAl2Si2O8, called anorthite, and the other end with sodium NaAlSi3O8, called albite. Note how the mineral accommodates the substitution of Ca++ and Na+. Minerals in this solid solution series have different mineral names.
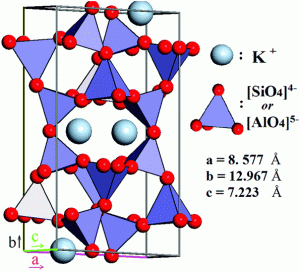
Note that aluminum, which has a similar ionic size to silicon, can substitute for silicon inside the tetrahedra (see figure). Because potassium ions are so much larger than sodium and calcium ions, which are very similar in size, the inability of the crystal lattice to accommodate both potassium and sodium/calcium gives rise to the two families of feldspar, orthoclase and plagioclase respectively. Framework silicates are called tectosilicates and include the alkali metal-rich feldspathoids and zeolites.
Take this quiz to check your comprehension of this section.

3.4 Non-Silicate Minerals
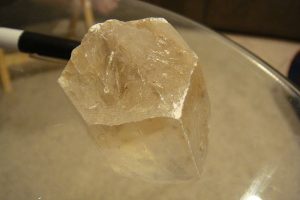
The crystal structure of non-silicate minerals (see table) does not contain silica-oxygen tetrahedra. Many non-silicate minerals are economically important and provide metallic resources such as copper, lead, and iron. They also include valuable non-metallic products such as salt, construction materials, and fertilizer.
| Mineral Group | Examples | Formula | Uses |
| Native elements | gold, silver, copper | Au, Ag, Cu | Jewelry, coins, industry |
| Carbonates | calcite, dolomite | CaCO3, CaMg(CO3)2 | Lime, Portland cement |
| Oxides | hematite, magnetite, bauxite | Fe2O3, Fe3O4, a mixture of aluminum oxides | Ores of iron & aluminum, pigments |
| Halides | halite, sylvite | NaCl, KCl | Table salt, fertilizer |
| Sulfides | galena, chalcopyrite, cinnabar | PbS, CuFeS2, HgS | Ores of lead, copper, mercury |
| Sulphates | gypsum, epsom salts | CaSo4·2H2O, MgSO4·7H2O | Sheetrock, therapeutic soak |
| Phosphates | apatite | Ca5(PO4)3(F,Cl,OH) | Fertilizer, teeth, bones |
Common non-silicate mineral groups.
3.4.1 Carbonates
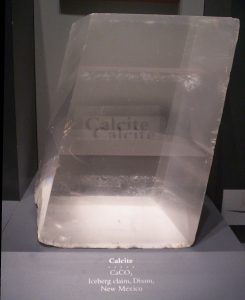
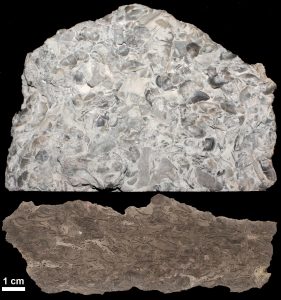
Calcite (CaCO3) and dolomite (CaMg(CO3)2) are the two most frequently occurring carbonate minerals, and usually occur in sedimentary rocks, such as limestone and dolostone rocks, respectively. Some carbonate rocks, such calcite and dolomite, are formed via evaporation and precipitation. However, most carbonate-rich rocks, such as limestone, are created by the lithification of fossilized marine organisms. These organisms, including those we can see and many microscopic organisms, have shells or exoskeletons consisting of calcium carbonate (CaCO3). When these organisms die, their remains accumulate on the floor of the water body in which they live and the soft body parts decompose and dissolve away. The calcium carbonate hard parts become included in the sediments, eventually becoming the sedimentary rock called limestone. While limestone may contain large, easy to see fossils, most limestones contain the remains of microscopic creatures and thus originate from biological processes.
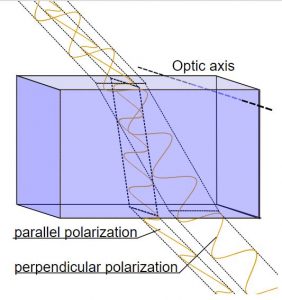
Calcite crystals show an interesting property called birefringence, meaning they polarize light into two wave components vibrating at right angles to each other. As the two light waves pass through the crystal, they travel at different velocities and are separated by refraction into two different travel paths. In other words, the crystal produces a double image of objects viewed through it. Because they polarize light, calcite crystals are used in special petrographic microscopes for studying minerals and rocks.
Many non-silicate minerals are referred to as salts. The term salts used here refers to compounds made by replacing the hydrogen in natural acids. The most abundant natural acid is carbonic acid that forms by the solution of carbon dioxide in water. Carbonate minerals are salts built around the carbonate ion (CO3-2) where calcium and/or magnesium replace the hydrogen in carbonic acid (H2CO3). Calcite and a closely related polymorph aragonite are secreted by organisms to form shells and physical structures like corals. Many such creatures draw both calcium and carbonate from dissolved bicarbonate ions (HCO3-) in ocean water. As seen in the mineral identification section below, calcite is easily dissolved in acid and thus effervesces in dilute hydrochloric acid (HCl). Small dropper bottles of dilute hydrochloric acid are often carried by geologists in the field as well as used in mineral identification labs.
Other salts include halite (NaCl) in which sodium replaces the hydrogen in hydrochloric acid and gypsum (Ca[SO4] • 2 H2O) in which calcium replaces the hydrogen in sulfuric acid. Note that some water molecules are also included in the gypsum crystal. Salts are often formed by evaporation and are called evaporite minerals.
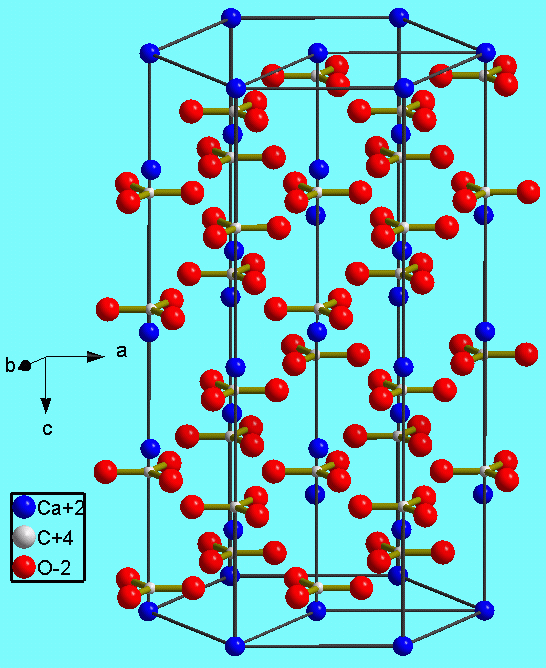
The figure shows the crystal structure of calcite (CaCO3). Like silicon, carbon has four valence electrons. The carbonate unit consists of carbon atoms (tiny white dots) covalently bonded to three oxygen atoms (red), one oxygen sharing two valence electrons with the carbon and the other two sharing one valence electron each with the carbon, thus creating triangular units with a charge of -2. The negatively charged carbonate unit forms an ionic bond with the Ca ion (blue), which as a charge of +2.
3.4.2 Oxides, Halides, and Sulfides
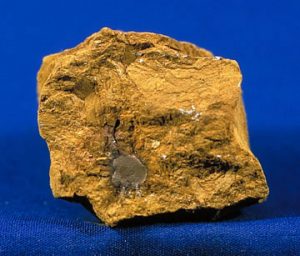
After carbonates, the next most common non-silicate minerals are the oxides, halides, and sulfides.
Oxides consist of metal ions covalently bonded with oxygen. The most familiar oxide is rust, which is a combination of iron oxides (Fe2O3) and hydrated oxides. Hydrated oxides form when iron is exposed to oxygen and water. Iron oxides are important for producing metallic iron. When iron oxide or ore is smelted, it produces carbon dioxide (CO2) and metallic iron.
The red color in rocks is usually due to the presence of iron oxides. For example, the red sandstone cliffs in Zion National Park and throughout Southern Utah consist of white or colorless grains of quartz coated with iron oxide which serve as cementing agents holding the grains together.
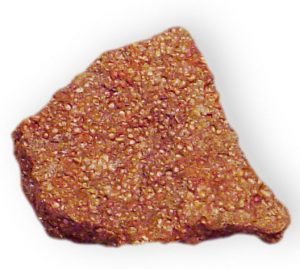
Other iron oxides include limonite, magnetite, and hematite. Hematite occurs in many different crystal forms. The massive form shows no external structure. Botryoidal hematite shows large concentric blobs. Specular hematite looks like a mass of shiny metallic crystals. Oolitic hematite looks like a mass of dull red fish eggs. These different forms of hematite are polymorphs and all have the same formula, Fe2O3.
Other common oxide minerals include:
- ice (H2O), an oxide of hydrogen
- bauxite (Al2H2O4), hydrated oxides of aluminum, an ore for producing metallic aluminum
- corundum (Al2O3), which includes ruby and sapphire gemstones.
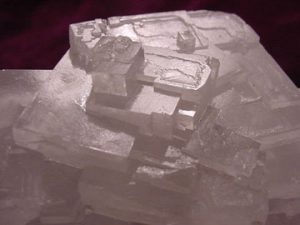
The halides consist of halogens in column VII, usually fluorine or chlorine, ionically bonded with sodium or other cations. These include halite or sodium chloride (NaCl), common table salt; sylvite or potassium chloride (KCl); and fluorite or calcium fluoride (CaF2).
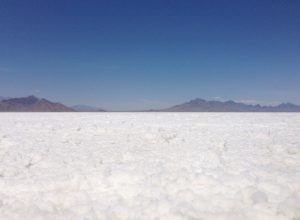
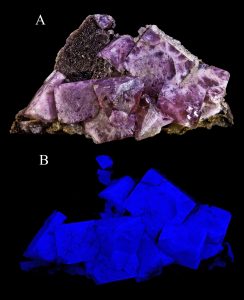
Halide minerals usually form from the evaporation of sea water or other isolated bodies of water. A well-known example of halide mineral deposits created by evaporation is the Bonneville Salt Flats, located west of the Great Salt Lake in Utah (see figure).
Many important metal ores are sulfides, in which metals are bonded to sulfur. Significant examples include: galena (lead sulfide), sphalerite (zinc sulfide), pyrite
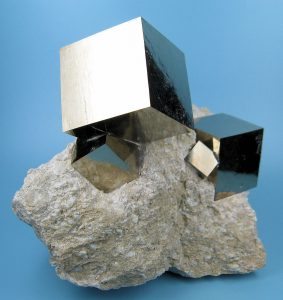
(iron sulfide, sometimes called “fool's gold”), and chalcopyrite (iron-copper sulfide). Sulfides are well known for being important ore minerals. For example, galena is the main source of lead, sphalerite is the main source of zinc, and chalcopyrite is the main copper ore mineral mined in porphyry deposits like the Bingham mine (see chapter 16). The largest sources of nickel, antimony, molybdenum, arsenic, and mercury are also sulfides.
3.4.3 Sulfates
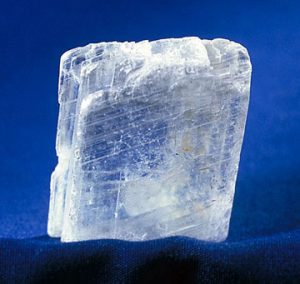
Sulfate minerals contain a metal ion, such as calcium, bonded to a sulfate ion. The sulfate ion is a combination of sulfur and oxygen (SO4-2). The sulfate mineral gypsum (CaSO4ᐧ2H2O) is used in construction materials such as plaster and drywall. Gypsum is often formed from evaporating water and usually contains water molecules in its crystalline structure. The ᐧ2H2O in the formula indicates the water molecules are whole H2O. This is different from minerals like amphibole, which contain a hydroxide ion (OH-) that is derived from water, but is missing a hydrogen ion (H+). The calcium sulfate without water is a different mineral than gypsum called anhydrite (CaSO4).
3.4.4 Phosphates
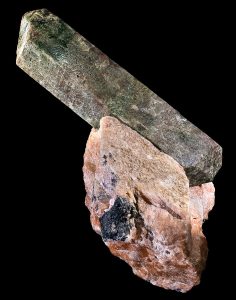
Phosphate minerals have a tetrahedral phosphate unit (PO4-3) combined with various anions and cations. In some cases arsenic or vanadium can substitute for phosphorus. Phosphates are an important ingredient of fertilizers as well as detergents, paint, and other products. The best known phosphate mineral is apatite, Ca5(PO4)3(F,Cl,OH), variations of which are found in teeth and bones. The gemstone turquoise [CuAl6(PO4)4(OH)8·4H2O ] is a copper-rich phosphate mineral that, like gypsum, contains water molecules.
3.4.5 Native Element Minerals
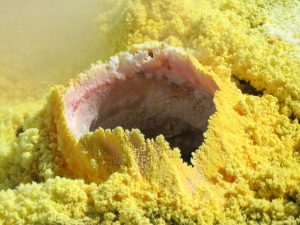
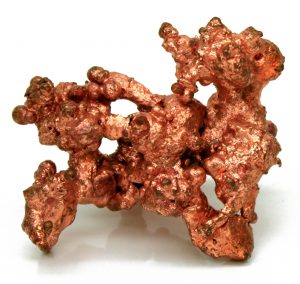
Native element minerals, usually metals, occur in nature in a pure or nearly pure state. Gold is an example of a native element mineral; it is not very reactive and rarely bonds with other elements so it is usually found in an isolated or pure state. The non-metallic and poorly-reactive mineral carbon is often found as a native element, such as graphite and diamonds. Mildly reactive metals like silver, copper, platinum, mercury, and sulfur sometimes occur as native element minerals. Reactive metals such as iron, lead, and aluminum almost always bond to other elements and are rarely found in a native state.
Take this quiz to check your comprehension of this section.

3.5 Identifying Minerals
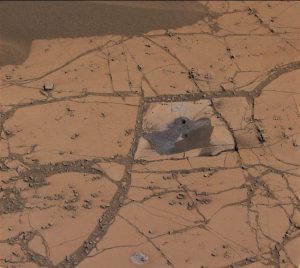
Geologists identify minerals by their physical properties. In the field, where geologists may have limited access to advanced technology and powerful machines, they can still identify minerals by testing several physical properties: luster and color, streak, hardness, crystal habit, cleavage and fracture, and some special properties. Only a few common minerals make up the majority of Earth's rocks and are usually seen as small grains in rocks. Of the several properties used for identifying minerals, it is good to consider which will be most useful for identifying them in small grains surrounded by other minerals.
3.5.1 Luster and Color
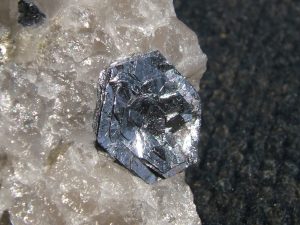
The first thing to notice about a mineral is its surface appearance, specifically luster and color. Luster describes how the mineral looks. Metallic luster looks like a shiny metal such as chrome, steel, silver, or gold. Submetallic luster has a duller appearance. Pewter, for example, shows submetallic luster.
Nonmetallic luster doesn’t look like a metal and may be described as vitreous (glassy), earthy, silky, pearly, and other surface qualities. Nonmetallic minerals may be shiny, although their vitreous shine is different from metallic luster. See the table for descriptions and examples of nonmetallic luster.
| Luster | Image | Description |
|---|---|---|
| Vitreous/glassy |
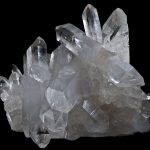 |
Surface is shiny like glass |
| Earthy/dull |
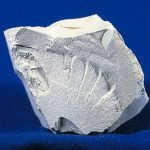 |
Dull, like dried mud or clay |
| Silky |
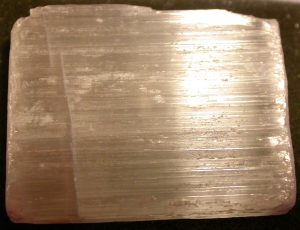 |
Soft shine like silk fabric |
| Pearly |
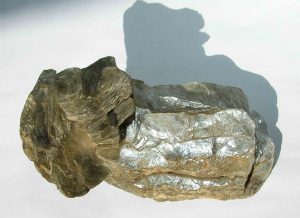 |
Like the inside of a clam shell or mother-of-pearl |
| Submetallic |
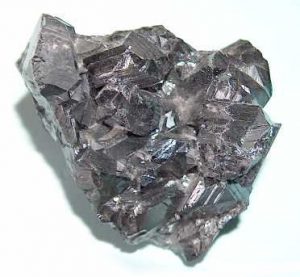 |
Has the appearance of dull metal, like pewter. These minerals would usually still be considered metallic. Submetallic appearance can occur in metallic minerals because of weathering. |
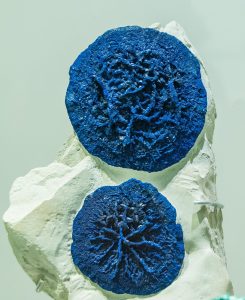
Surface color may be helpful in identifying minerals, although it can be quite variable within the same mineral family. Mineral colors are affected by the main elements as well as impurities in the crystals. These impurities may be rare elements—like manganese, titanium, chromium, or lithium—even other molecules that are not normally part of the mineral formula. For example, the incorporation of water molecules gives quartz, which is normally clear, a milky color.
Some minerals predominantly show a single color. Malachite and azurite are green and blue, respectively, because of their copper content. Other minerals have a predictable range of colors due to elemental substitutions, usually via a solid solution. Feldspars, the most abundant minerals in the earth’s crust, are complex, have solid solution series, and present several colors including pink, white, green, gray and others. Other minerals also come in several colors, influenced by trace amounts of several elements. The same element may show up as different colors, in different minerals. With notable exceptions, color is usually not a definitive property of minerals. For identifying many minerals. a more reliable indicator is streak, which is the color of the powdered mineral.
3.5.2 Streak
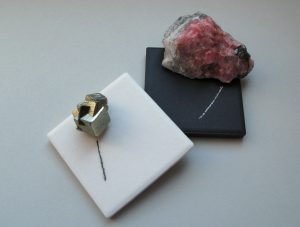
Streak examines the color of a powdered mineral, and can be seen when a mineral sample is scratched or scraped on an unglazed porcelain streak plate. A paper page in a field notebook may also be used for the streak of some minerals. Minerals that are harder than the streak plate will not show streak, but will scratch the porcelain. For these minerals, a streak test can be obtained by powdering the mineral with a hammer and smearing the powder across a streak plate or notebook paper.
While mineral surface colors and appearances may vary, their streak colors can be diagnostically useful. An example of this property is seen in the iron-oxide mineral hematite. Hematite occurs in a variety of forms, colors and lusters, from shiny metallic silver to earthy red-brown, and different physical appearances. A hematite streak is consistently reddish brown, no matter what the original specimen looks like. Iron sulfide or pyrite, is a brassy metallic yellow. Commonly named fool’s gold, pyrite has a characteristic black to greenish-black streak.
3.5.3 Hardness
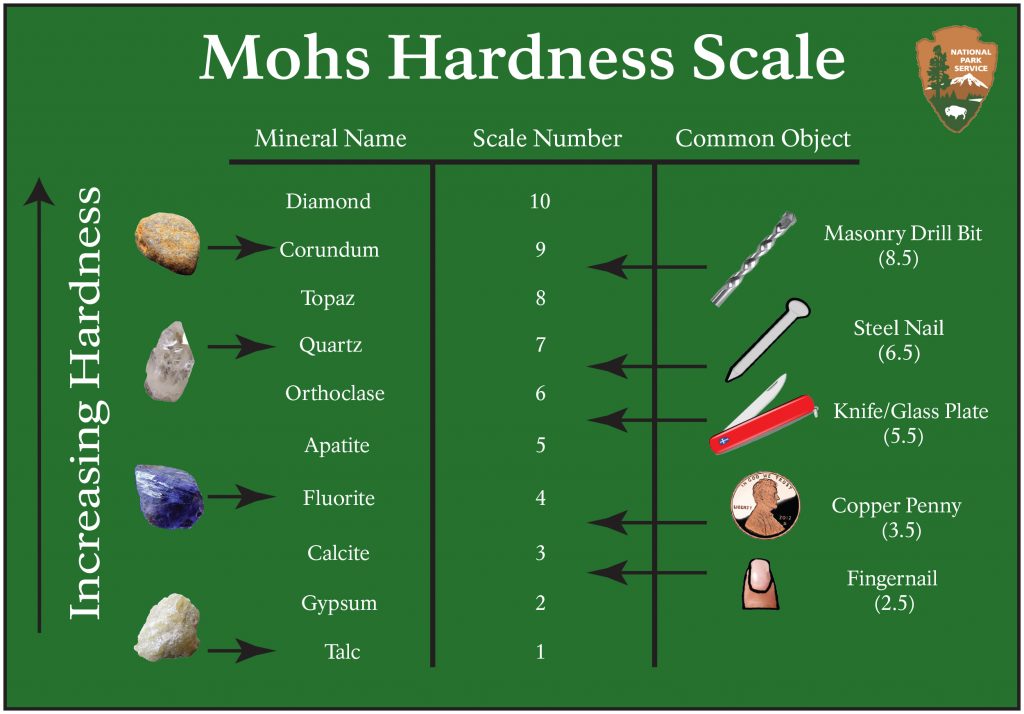
Hardness measures the ability of a mineral to scratch other substances. The Mohs Hardness Scale gives a number showing the relative scratch-resistance of minerals when compared to a standardized set of minerals of increasing hardness. The Mohs scale was developed by German geologist Fredrick Mohs in the early 20th century, although the idea of identifying minerals by hardness goes back thousands of years. Mohs hardness values are determined by the strength of a mineral’s atomic bonds.
The figure shows the minerals associated with specific hardness values, together with some common items readily available for use in field testing and mineral identification. The hardness values run from 1 to 10, with 10 being the hardest; however, the scale is not linear. Diamond defines a hardness of 10 and is actually about four times harder than corundum, which is 9. A steel pocketknife blade, which has a hardness value of 5.5, separates between hard and soft minerals on many mineral identification keys.
3.5.4 Crystal Habit
Minerals can be identified by crystal habit, how their crystals grow and appear in rocks. Crystal shapes are determined by the arrangement of the atoms within the crystal structure. For example, a cubic arrangement of atoms gives rise to a cubic-shaped mineral crystal. Crystal habit refers to typically observed shapes and characteristics; however, they can be affected by other minerals crystallizing in the same rock. When minerals are constrained so they do not develop their typical crystal habit, they are called anhedral. Subhedral crystals are partially formed shapes. For some minerals characteristic crystal habit is to grow crystal faces even when surrounded by other crystals in rock. An example is garnet. Minerals grown freely where the crystals are unconstrained and can take characteristic shapes often form crystal faces. A euhedral crystal has a perfectly formed, unconstrained shape. Some minerals crystallize in such tiny crystals, they do not show a specific crystal habit to the naked eye. Other minerals, like pyrite, can have an array of different crystal habits, including cubic, dodecahedral, octahedral, and massive. The table lists typical crystal habits of various minerals.
| Habit | Image | Examples |
|---|---|---|
| Bladed
long and flat crystals |
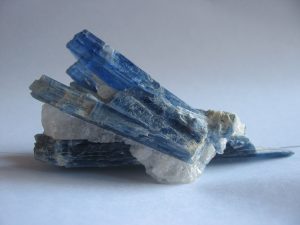 |
kyanite, amphibole, gypsum |
| Botryoidal/mammillary
blobby, circular crystals |
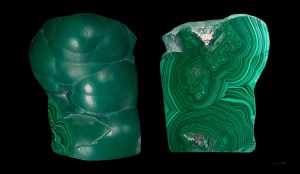 |
hematite, malachite, smithsonite |
| Coating/laminae/druse
crystals that are small and coat surfaces |
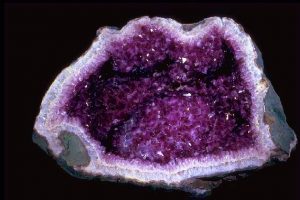 |
quartz, calcite, malachite, azurite |
| Cubic
cube-shaped crystals |
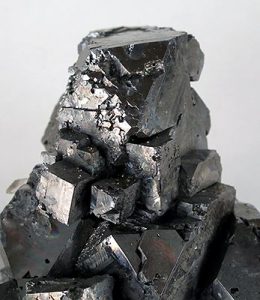 |
pyrite, galena, halite |
| Dodecahedral
12-sided polygon shapes |
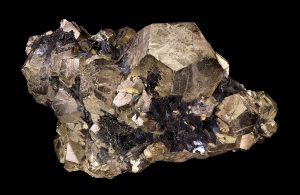 |
garnet, pyrite |
| Dendritic
branching crystals |
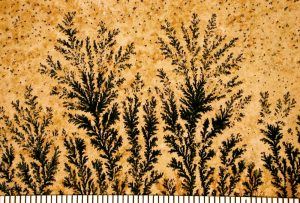 |
Mn-oxides, copper, gold |
| Equant
crystals that do not have a long direction |
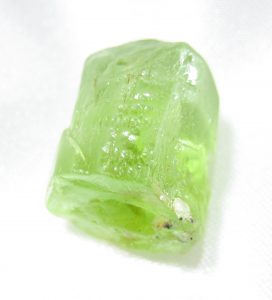 |
olivine, garnet, pyroxene |
| Fibrous
thin, very long crystals |
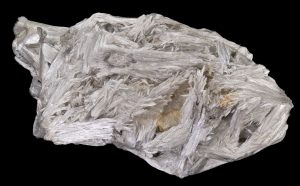 |
serpentine, amphibole, zeolite |
| Layered, sheets
stacked, very thin, flat crystals |
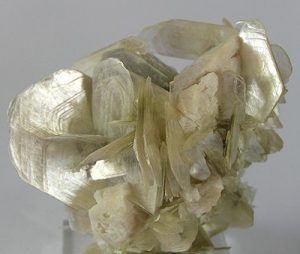 |
mica (biotite, muscovite, etc.) |
| Lenticular/platy
crystals that are plate-like |
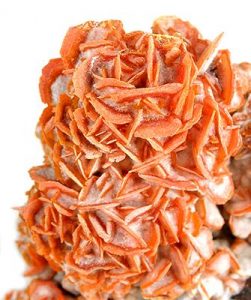 |
selenite roses, wulfenite, calcite |
| Hexagonal
crystals with six sides |
 |
quartz, hanksite, corundum |
| Massive/granular
Crystals with no obvious shape, microscopic crystals |
 |
limonite, pyrite, azurite, bornite |
| Octahedral
4-sided double pyramid crystals |
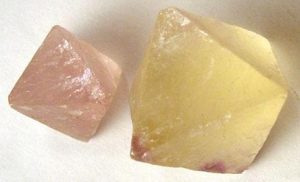 |
diamond, fluorite, magnetite, pyrite |
| Prismatic/columnar
very long, cylindrical crystals |
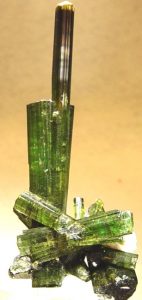 |
tourmaline, beryl, barite |
| Radiating
crystals that grow from a point and fan out |
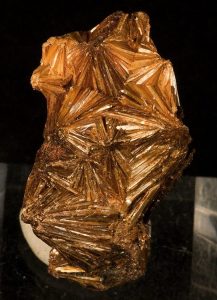 |
pyrite "suns", pyrophyllite |
| Rhombohedral
crystals shaped like slanted cubes |
 |
calcite, dolomite |
| Tabular/blocky/stubby
sharp-sided crystals with no long direction |
 |
feldspar, pyroxene, calcite |
| Tetrahedral
three-sided, pyramid-shaped crystals |
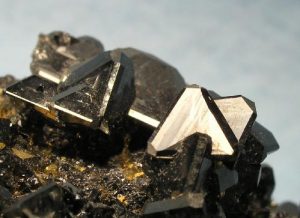 |
magnetite, spinel, tetrahedrite |
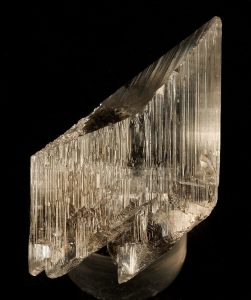
Another crystal habit that may be used to identify minerals is striations, which are dark and light parallel lines on a crystal face. Twinning is another, which occurs when the crystal structure replicates in mirror images along certain directions in the crystal.
Striations and twinning are related properties in some minerals including plagioclase feldspar. Striations are optical lines on a cleavage surface. Because of twinning in the crystal, striations show up on one of the two cleavage faces of the plagioclase crystal.
3.5.5 Cleavage and Fracture
Minerals often show characteristic patterns of breaking along specific cleavage planes or show characteristic fracture patterns. Cleavage planes are smooth, flat, parallel planes within the crystal. The cleavage planes may show as reflective surfaces on the crystal, as parallel cracks that penetrate into the crystal, or show on the edge or side of the crystal as a series of steps like rice terraces. Cleavage arises in crystals where the atomic bonds between atomic layers are weaker along some directions than others, meaning they will break preferentially along these planes. Because they develop on atomic surfaces in the crystal, cleavage planes are optically smooth and reflect light, although the actual break on the crystal may appear jagged or uneven. In such cleavages, the cleavage surface may appear like rice terraces on a mountainside that all reflect sunlight from a particular sun angle. Some minerals have a strong cleavage, some minerals only have weak cleavage or do not typically demonstrate cleavage.
For example, quartz and olivine rarely show cleavage and typically break into conchoidal fracture patterns.
Graphite has its carbon atoms arranged into layers with relatively strong bonds within the layer and very weak bonds between the layers. Thus graphite cleaves readily between the layers and the layers slide easily over one another giving graphite its lubricating quality.
Mineral fracture surfaces may be rough and uneven or they may be show conchoidal fracture. Uneven fracture patterns are described as irregular, splintery, fibrous. A conchoidal fracture has a smooth, curved surface like a shallow bowl or conch shell, often with curved ridges. Natural volcanic glass, called obsidian, breaks with this characteristic conchoidal pattern
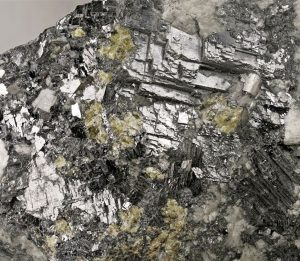
To work with cleavage, it is important to remember that cleavage is a result of bonds separating along planes of atoms in the crystal structure. On some minerals, cleavage planes may be confused with crystal faces. This will usually not be an issue for crystals of minerals that grew together within rocks. The act of breaking the rock to expose a fresh face will most likely break the crystals along cleavage planes. Some cleavage planes are parallel with crystal faces but many are not. Cleavage planes are smooth, flat, parallel planes within the crystal. The cleavage planes may show as parallel cracks that penetrate into the crystal (see amphibole below), or show on the edge or side of the crystal as a series of steps like rice terraces. For some minerals characteristic crystal habit is to grow crystal faces even when surrounded by other crystals in rock. An example is garnet. Minerals grown freely where the crystals are unconstrained and can take characteristic shapes often form crystal faces (see quartz below).

In some minerals, distinguishing cleavage planes from crystal faces may be challenging for the student. Understanding the nature of cleavage and referring to the number of cleavage planes and cleavage angles on identification keys should provide the student with enough information to distinguish cleavages from crystal faces. Cleavage planes may show as multiple parallel cracks or flat surfaces on the crystal. Cleavage planes may be expressed as a series of steps like terraced rice paddies. See the cleavage surfaces on galena above or plagioclase below. Cleavage planes arise from the tendency of mineral crystals to break along specific planes of weakness within the crystal favored by atomic arrangements. The number of cleavage planes, the quality of the cleavage surfaces, and the angles between them are diagnostic for many minerals and cleavage is one of the most useful properties for identifying minerals. Learning to recognize cleavage is an especially important and useful skill in studying minerals.
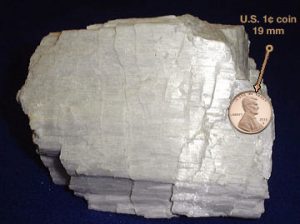
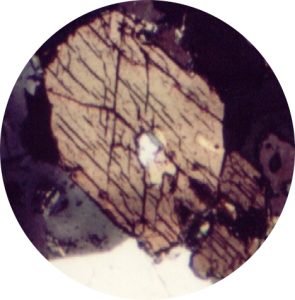
As an identification property of minerals, cleavage is usually given in terms of the quality of the cleavage (perfect, imperfect, or none), the number of cleavage surfaces, and the angles between the surfaces. The most common number of cleavage plane directions in the common rock-forming minerals are: one perfect cleavage (as in mica), two cleavage planes (as in feldspar, pyroxene, and amphibole), and three cleavage planes (as in halite, calcite, and galena). One perfect cleavage (as in mica) develops on the top and bottom of the mineral specimen with many parallel cracks showing on the sides but no angle of intersection. Two cleavage planes intersect at an angle. Common cleavage angles are 60°, 75°, 90°, and 120°. Amphibole has two cleavage planes at 60° and 120°. Galena and halite have three cleavage planes at 90° (cubic cleavage). Calcite cleaves readily in three directions producing a cleavage figure called a rhomb that looks like a cube squashed over toward one corner giving rise to the approximately 75° cleavage angles. Pyroxene has an imperfect cleavage with two planes at 90°.
Cleavages on common rock-forming minerals
- Quartz—none (conchoidal fracture)
- Olivine—none (conchoidal fracture)
- Mica—1 perfect
- Feldspar—2 perfect at 90°
- Pyroxene—2 imperfect at 90°
- Amphibole—2 perfect at 60°/120°
- Calcite—3 perfect at approximately 75°
- Halite, galena, pyrite—3 perfect at 90°
3.5.6 Special Properties

Special properties are unique and identifiable characteristics used to identify minerals or that allow some minerals to be used for special purposes. Ulexite has a fiber-optic property that can project images through the crystal like a high-definition television screen (see figure). A simple identifying special property is taste, such as the salty flavor of halite or common table salt (NaCl). Sylvite is potassium chloride (KCl) and has a more bitter taste.
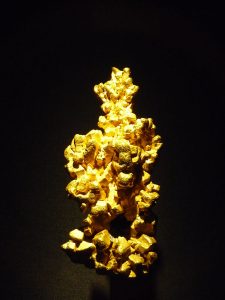
Another property geologists may use to identify minerals is a property related to density called specific gravity. Specific gravity measures the weight of a mineral specimen relative to the weight of an equal volume of water. The value is expressed as a ratio between the mineral and water weights. To measure specific gravity, a mineral specimen is first weighed in grams then submerged in a graduated cylinder filled with pure water at room temperature. The rise in water level is noted using the cylinder’s graduated scale. Since the weight of water at room temperature is 1 gram per cubic centimeter, the ratio of the two weight numbers gives the specific gravity. Specific gravity is easy to measure in the laboratory but is less useful for mineral identification in the field than other more easily observed properties, except in a few rare cases such as the very dense galena or native gold. The high density of these minerals gives rise to a qualitative property called “heft.” Experienced geologists can roughly assess specific gravity by heft, a subjective quality of how heavy the specimen feels in one’s hand relative to its size.
A simple test for identifying calcite and dolomite is to drop a bit of dilute hydrochloric acid (10-15% HCl) on the specimen. If the acid drop effervesces or fizzes on the surface of the rock, the specimen is calcite. If it does not, the specimen is scratched to produce a small amount of powder and test with acid again. If the acid drop fizzes slowly on the powdered mineral, the specimen is dolomite. The difference between these two minerals can be seen in the video. Geologists who work with carbonate rocks carry a small dropper bottle of dilute HCl in their field kit. Vinegar, which contains acetic acid, can be used for this test and is used to distinguish non-calcite fossils from limestone. While acidic, vinegar produces less of a fizzing reaction because acetic acid is a weaker acid.

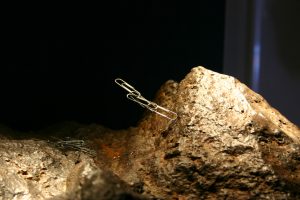
Some iron-oxide minerals are magnetic and are attracted to magnets. A common name for a naturally magnetic iron oxide is lodestone. Others include magnetite (Fe3O4) and ilmenite (FeTiO3). Magnetite is strongly attracted to magnets and can be magnetized. Ilmenite and some types of hematite are weakly magnetic.

Some minerals and mineraloids scatter light via a phenomenon called iridescence. This property occurs in labradorite (a variety of plagioclase) and opal. It is also seen in biologically created substances like pearls and seashells. Cut diamonds show iridescence and the jeweler’s diamond cut is designed to maximize this property.
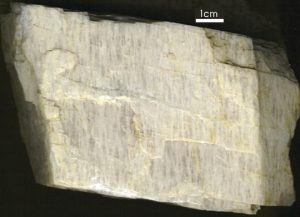
Striations on mineral cleavage faces are an optical property that can be used to separate plagioclase feldspar from potassium feldspar (K-spar). A process called twinning creates parallel zones in the crystal that are repeating mirror images. The actual cleavage angle in plagioclase is slightly different than 90o and the alternating mirror images in these twinned zones produce a series of parallel lines on one of plagioclase’s two cleavage faces. Light reflects off these twinned lines at slightly different angles which then appear as light and dark lines called striations on the cleavage surface. Potassium feldspar does not exhibit twinning or striations but may show linear features called exsolution lamellae, also known as perthitic lineation or simply perthite. Because sodium and potassium do not fit into the same feldspar crystal structure, the lines are created by small amounts of sodium feldspar (albite) separating from the dominant potassium feldspar (K-spar) within the crystal structure. The two different feldspars crystallize out into roughly parallel zones within the crystal, which are seen as these linear markings.

One of the most interesting special mineral properties is fluorescence. Certain minerals, or trace elements within them, give off visible light when exposed to ultraviolet radiation or black light. Many mineral exhibits have a fluorescence room equipped with black lights so this property can be observed. An even rarer optical property is phosphorescence. Phosphorescent minerals absorb light and then slowly release it, much like a glow-in-the-dark sticker.
Take this quiz to check your comprehension of this section.

Summary
Minerals are the building blocks of rocks and essential to understanding geology. Mineral properties are determined by their atomic bonds. Most minerals begin in a fluid, and either crystallize out of cooling magma or precipitate as ions and molecules out of a saturated solution. The silicates are largest group of minerals on Earth, by number of varieties and relative quantity, making up a large portion of the crust and mantle. Based on the silicon-oxygen tetrahedra, the crystal structure of silicates reflects the fact that silicon and oxygen are the top two of Earth’s most abundant elements. Non-silicate minerals are also economically important, and providing many types of construction and manufacturing materials. Minerals are identified by their unique physical properties, including luster, color, streak, hardness, crystal habit, fracture, cleavage, and special properties.
Take this quiz to check your comprehension of this Chapter.

References
- Clarke, F.W.H.S.W., 1927, The Composition of the Earth’s Crust: Professional Paper, United States Geological Survey, Professional Paper.
- Gordon, L.M., and Joester, D., 2011, Nanoscale chemical tomography of buried organic-inorganic interfaces in the chiton tooth: Nature, v. 469, no. 7329, p. 194–197.
- Hans Wedepohl, K., 1995, The composition of the continental crust: Geochim. Cosmochim. Acta, v. 59, no. 7, p. 1217–1232.
- Lambeck, K., 1986, Planetary evolution: banded iron formations: v. 320, no. 6063, p. 574–574.
- metallic bond | chemistry.
- Scerri, E.R., 2007, The Periodic Table: Its Story and Its Significance: Oxford University Press, USA.
- Thomson, J.J., 1897, XL. Cathode Rays: Philosophical Magazine Series 5, v. 44, no. 269, p. 293–316.
- Trenn, T.J., Geiger, H., Marsden, E., and Rutherford, E., 1974, The Geiger-Marsden Scattering Results and Rutherford’s Atom, July 1912 to July 1913: The Shifting Significance of Scientific Evidence: Isis, v. 65, no. 1, p. 74–82.
By Ji-ElleIt feels nice and warmIt feels like a ________ (Own work) [CC BY-SA 3.0], via Wikimedia Commons
By Matt Affolter
Place where two plates slide past each other, creating strike slip faults.
A boundary between continental and oceanic plates that has relative movement, making it a plate boundary.
By Krishnavedala (Own work) [CC0], via Wikimedia Commons
Term for a rock made definitively of glacial till.
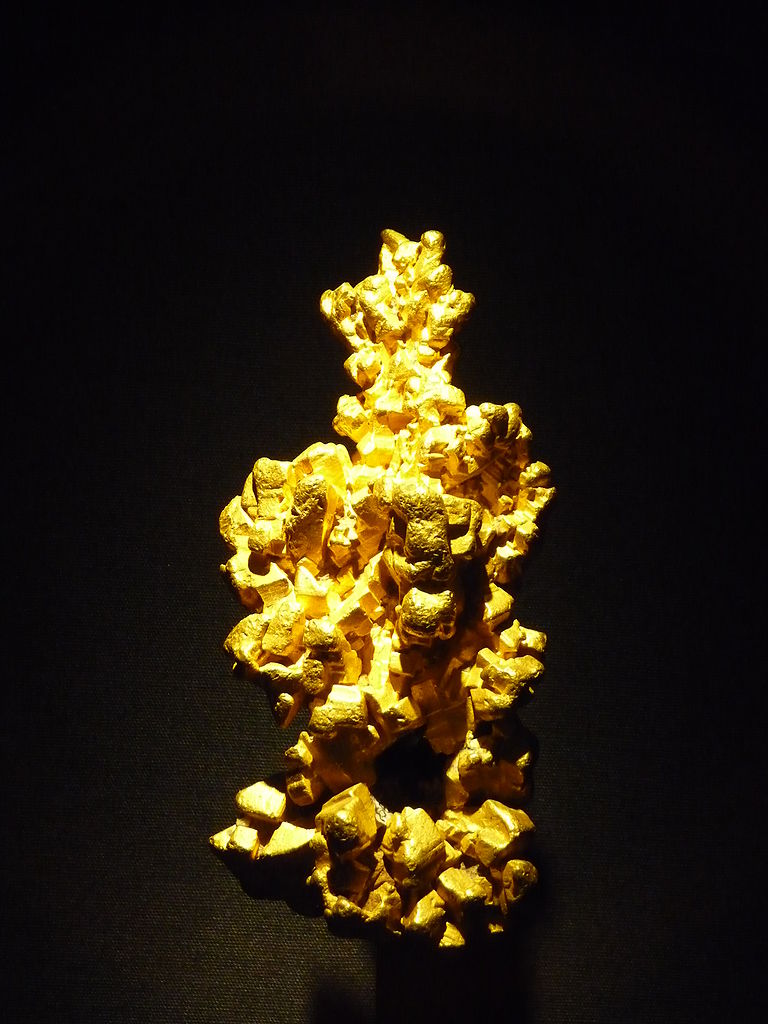
16 Energy and Mineral Resources
KEY CONCEPTS
- Describe how a renewable resource is different from a nonrenewable resource.
- Compare the pros and cons of extracting and using fossil fuels and conventional and unconventional petroleum sources.
- Describe how metallic minerals are formed and extracted.
- Understand how society uses nonmetallic mineral resources.
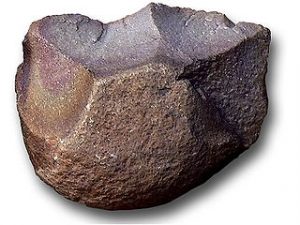
This text has previously discussed geology’s pioneers, such as scientists James Hutton and Charles Lyell, but the first real “geologists” were the hominids who picked up stones and began the stone age. Maybe stones were first used as curiosity pieces, maybe as weapons, but ultimately, they were used as tools. This was the Paleolithic Period, the beginning of geologic study, and it dates back 2.6 million years to east Africa.
In modern times, geologic knowledge is important for locating economically valuable materials for society’s use. In fact, all things we use come from only three sources: they are farmed, hunted or fished, or mined. At the turn of the twentieth century, speculation was rampant that food supplies would not keep pace with world demand, suggesting the need to develop artificial fertilizers. Sources of fertilizer ingredients are: nitrogen is processed from the atmosphere, using the Haber process for the manufacture of ammonia from atmospheric nitrogen and hydrogen; potassium comes from the hydrosphere, such as lakes or ocean evaporation; and phosphorus is mined from the lithosphere, such as minerals like apatite from phosphorite rock, which is found in Florida, North Carolina, Idaho, Utah, and around the world. Thus, without mining and processing of natural materials, modern civilization would not exist. Indeed, geologists are essential in this process.
16.1 Mining
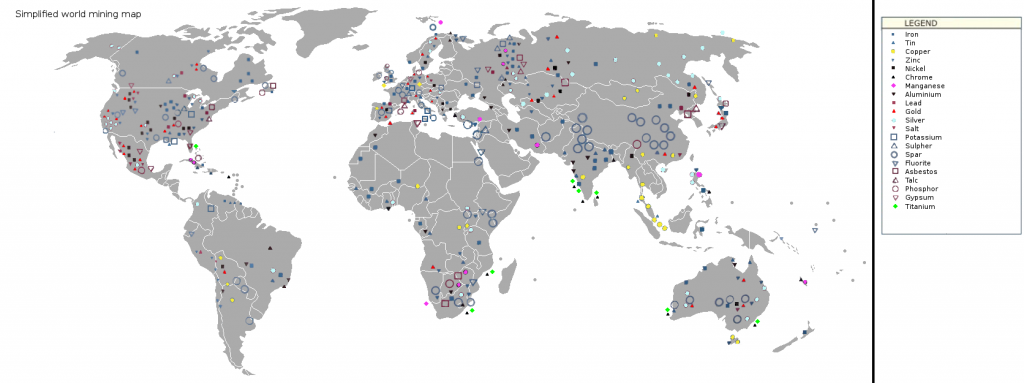
Mining is defined as extracting valuable materials from the Earth for society’s use. Usually, these include solid materials such as gold, iron, coal, diamond, sand, and gravel, but materials can also include fluid resources such as oil and natural gas. Modern mining has a long relationship with modern society. The oldest mine dates back 40,000 years to the Lion Cavern in Swaziland where there is evidence of concentrated digging into the Earth for hematite, an important iron ore used as red dye. Resources extracted by mining are generally considered to be nonrenewable.
16.1.1. Renewable vs. nonrenewable resources
Resources generally come in two major categories: renewable and nonrenewable. Renewable resources can be reused over and over or their availability replicated over a short human life span; nonrenewable resources cannot.
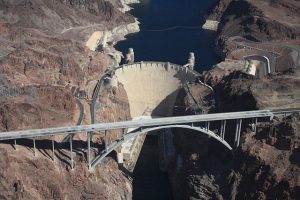
Renewable resources are materials present in our environment that can be exploited and replenished. Some common renewable energy sources are linked with green energy sources because they are associated with relatively small or easily remediated environmental impact. For example, solar energy comes from fusion within the Sun, which radiates electromagnetic energy. This energy reaches the Earth constantly and consistently and should continue to do so for about five billion more years. Wind energy, also related to solar energy, is maybe the oldest renewable energy and is used to sail ships and power windmills. Both solar and wind-generated energy are variable on Earth’s surface. These limitations are offset because we can use energy storing devices, such as batteries or electricity exchanges between producing sites. The Earth’s heat, known as geothermal energy, can be viable anywhere that geologists drill deeply enough. In practice, geothermal energy is more useful where heat flow is great, such as volcanic zones or regions with a thinner crust. Hydroelectric dams provide energy by allowing water to fall through the dam under gravity, which activates turbines that produce the energy. Ocean tides are also a reliable energy source. All of these renewable resources provide energy that powers society. Other renewable resources are plant and animal matter, which are used for food, clothing, and other necessities, but are being researched as possible energy sources.
Nonrenewable resources cannot be replenished at a sustainable rate. They are finite within human time frames. Many nonrenewable resources come from planetary, tectonic, or long-term biologic processes and include materials such as gold, lead, copper, diamonds, marble, sand, natural gas, oil, and coal. Most nonrenewable resources include specific concentrated elements listed on the periodic table; some are compounds of those elements. For example, if society needs iron (Fe) sources, then an exploration geologist will search for iron-rich deposits that can be economically extracted. Nonrenewable resources may be abandoned when other materials become cheaper or serve a better purpose. For example, coal is abundantly available in England and other nations, but because oil and natural gas are available at a lower cost and lower environmental impact, coal use has decreased. Economic competition among nonrenewable resources is shifting use away from coal in many developed countries.
16.1.2. Ore
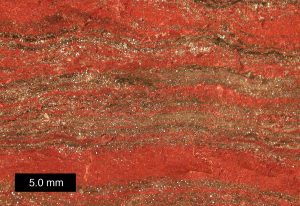
Earth’s materials include the periodic table elements. However, it is rare that these elements are concentrated to the point where it is profitable to extract and process the material into usable products. Any place where a valuable material is concentrated is a geologic and geochemical anomaly. A body of material from which one or more valuable substances can be mined at a profit, is called an ore deposit. Typically, the term ore is used for only metal-bearing minerals, but it can be applied to valuable nonrenewable resource concentrations such as fossil fuels, building stones, and other nonmetal deposits, even groundwater. If a metal-bearing resource is not profitable to mine, it is referred to as a mineral deposit. The term natural resource is more common than the term ore for non-metal-bearing materials.
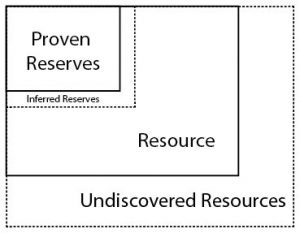
It is implicit that the technology to mine is available, economic conditions are suitable, and political, social and environmental considerations are satisfied in order to classify a natural resource deposit as ore. Depending on the substance, it can be concentrated in a narrow vein or distributed over a large area as a low-concentration ore. Some materials are mined directly from bodies of water (e.g. sylvite for potassium; water through desalination) and the atmosphere (e.g. nitrogen for fertilizers). These differences lead to various methods of mining, and differences in terminology depending on the certainty. Ore mineral resource is used for an indication of ore that is potentially extractable, and the term ore mineral reserve is used for a well defined (proven), profitable amount of extractable ore.
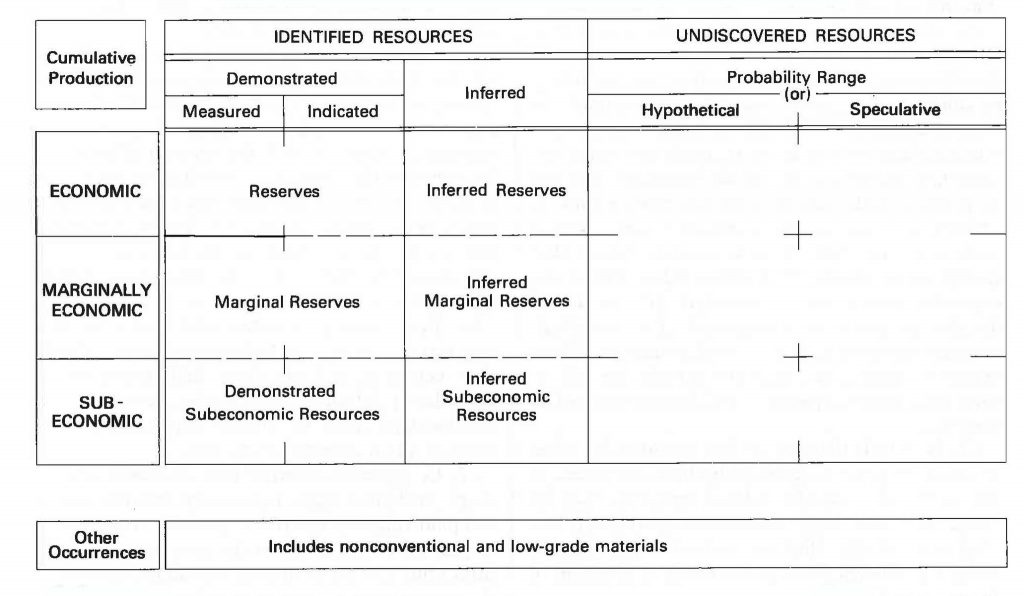
16.1.3. Mining Techniques
The mining style is determined by technology, social license, and economics. It is in the best interest of the company extracting the resources to do so in a cost-effective way. Fluid resources, such as oil and gas, are extracted by drilling wells and pumping. Over the years, drilling has evolved into a complex discipline in which directional drilling can produce multiple bifurcations and curves originating from a single drill collar at the surface. Using geophysical tools like seismic imaging, geologists can pinpoint resources and extract efficiently.
Solid resources are extracted by two principal methods of which there are many variants. Surface mining is used to remove material from the outermost part of the Earth. Open pit mining is used to target shallow, broadly disseminated resources.
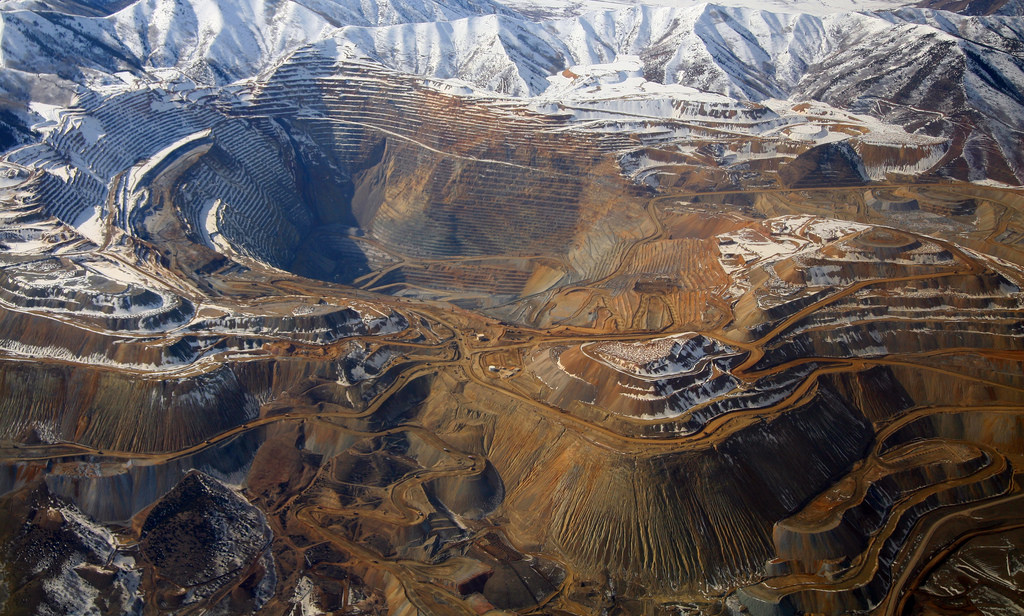
Open pit mining requires careful study of the ore body through surface mapping and drilling exploratory cores. The pit is progressively deepened through additional mining cuts to extract the ore. Typically, the pit’s walls are as steep as can be safely managed. Once the pit is deepened, widening the top is very expensive. A steep wall is thus an engineering balance between efficient and profitable mining (from the company's point of view) and mass wasting (angle of repose from a safety p0int of view) so that there is less waste to remove. The waste is called non-valuable rock or overburden and moving it is costly. Occasionally, landslides do occur, such as the very large landslide in the Kennecott Bingham Canyon mine, Utah, in 2013. These events are costly and dangerous. The job of engineering geologists is to carefully monitor the mine; when company management heeds their warnings, there is ample time and action to avoid or prepare for any slide.
Strip mining and mountaintop mining are surface mining techniques that are used to mine resources that cover large areas, especially layered resources, such as coal. In this method, an entire mountaintop or rock layer is removed to access the ore below. Surface mining’s environmental impacts are usually much greater due to the large surface footprint that’s disturbed.
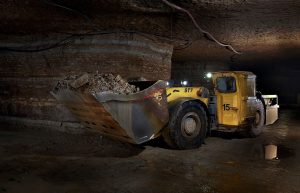
Underground mining is a method often used to mine higher-grade, more localized, or very concentrated resources. For one example, geologists mine some underground ore minerals by introducing chemical agents, which dissolve the target mineral. Then, they bring the solution to the surface where precipitation extracts the material. But more often, a mining shaft tunnel or a large network of these shafts and tunnels is dug to access the material. The decision to mine underground or from Earth’s surface is dictated by the ore deposit’s concentration, depth, geometry, land-use policies, economics, surrounding rock strength, and physical access to the ore. For example, to use surface mining techniques for deeper deposits might require removing too much material, or the necessary method may be too dangerous or impractical, or removing the entire overburden may be too expensive, or the mining footprint would be too large. These factors may prevent geologists from surface mining materials and cause a project to be mined underground. The mining method and its feasibility depends on the commodity’s price and the cost of the technology needed to remove it and deliver it to market. Thus, mines and the towns that support them come and go as the commodity price varies. And, conversely, technological advances and market demands may reopen mines and revive ghost towns.
16.1.4. Concentrating and Refining
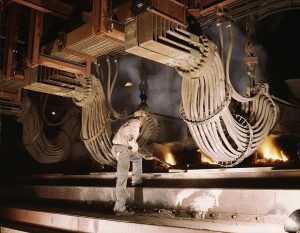
All ore minerals occur mixed with less desirable components called gangue. The process of physically separating gangue minerals from ore bearing minerals is called concentrating. Separating a desired element from a host mineral by chemical means, including heating, is called smelting. Finally, taking a metal such as copper and removing other trace metals such as gold or silver is done through the refining process. Typically, refining is done one of three ways: 1. Materials can either be mechanically separated and processed based on the ore mineral’s unique physical properties, such as recovering placer gold based on its high density. 2. Materials can be heated to chemically separate desired components, such as refining crude oil into gasoline. 3. Materials can be smelted, in which controlled chemical reactions unbind metals from the minerals they are contained in, such as when copper is taken out of chalcopyrite (CuFeS2). Mining, concentrating, smelting, and refining processes require enormous energy. Continual advances in metallurgy- and mining-practice strive to develop ever more energy efficient and environmentally benign processes and practices.
Take this quiz to check your comprehension of this section.

16.2. Fossil Fuels
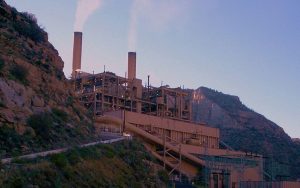
Fossils fuels are extractable sources of stored energy that were created by ancient ecosystems. The natural resources that typically fall under this category are coal, oil, petroleum, and natural gas. These resources were originally formed via photosynthesis by living organisms such as plants, phytoplankton, algae, and cyanobacteria. This energy is actually fossil solar energy, since the sun’s ancient energy was converted by ancient organisms into tissues that preserved the chemical energy within the fossil fuel. Of course, as the energy is used, just like photosynthetic respiration that occurs today, carbon enters the atmosphere as CO2, causing climate consequences (see Chapter 15). Today humanity uses fossil fuels for most of the world’s energy.
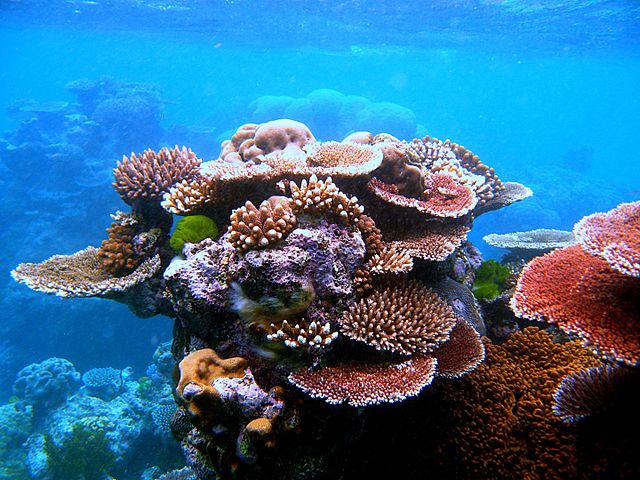
Converting solar energy by living organisms into hydrocarbon fossil fuels is a complex process. As organisms die, they decompose slowly, usually due to being buried rapidly, and the chemical energy stored within the organisms’ tissues is buried within surrounding geologic materials. All fossil fuels contain carbon that was produced in an ancient environment. In environments rich with organic matter such as swamps, coral reefs, and planktonic blooms, there is a higher potential for fossil fuels to accumulate. Indeed, there is some evidence that over geologic time, organic hydrocarbon fossil fuel material was highly produced globally. Lack of oxygen and moderate temperatures in the environment seem to help preserve these organic substances. Also, the heat and pressure applied to organic material after it is buried contribute to transforming it into higher quality materials, such as brown coal to anthracite and oil to gas. Heat and pressure can also cause mobile materials to migrate to conditions suitable for extraction.
16.2.1. Fossil Fuels
OIL AND GAS
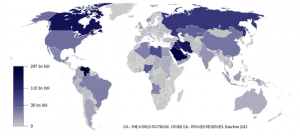
Petroleum is principally derived from organic-rich shallow marine sedimentary deposits where the remains of micro-organisms like plankton accumulated in fine grained sediments. Petroleum’s liquid component is called oil, and its gas component is called natural gas, which is mostly made up of methane (CH4). As rocks such as shale, mudstone, or limestone lithify, increasing pressure and temperature cause the oil and gas to be squeezed out and migrate from the source rock to a different rock unit higher in the rock column. Similar to the discussion of good aquifers in Chapter 11, if that rock is a sandstone, limestone, or other porous and permeable rock, and involved in a suitable stratigraphic or structural trapping process, then that rock can act as an oil and gas reservoir.
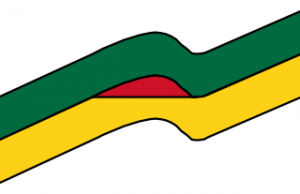
A trap is a combination of a subsurface geologic structure, a porous and permeable rock, and an impervious layer that helps block oil and gas from moving further, which concentrates it for humans to extract later. A trap develops due to many different geologic situations. Examples include an anticline or domal structure, an impermeable salt dome, or a fault bounded stratigraphic block, which is porous rock next to nonporous rock. The different traps have one thing in common: they pool fluid fossil fuels into a configuration in which extracting it is more likely to be profitable. Oil or gas in strata outside of a trap renders it less viable to extract.
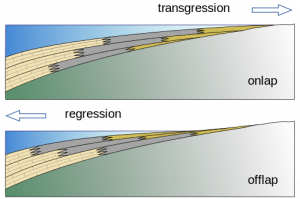
Sequence stratigraphy is a branch of geology that studies sedimentary facies both horizontally and vertically and is devoted to understanding how sea level changes create organic-rich shallow marine muds, carbonates, and sands in areas that are close to each other. For example, shoreline environments may have beaches, lagoons, reefs, nearshore and offshore deposits, all next to each other. Beach sand, lagoonal and nearshore muds, and coral reef layers accumulate into sediments that include sandstones—good reservoir rocks— next to mudstones, next to limestones, both of which are potential source rocks. As sea level either rises or falls, the shoreline’s location changes, and the sand, mud, and reef locations shift with it (see the figure). This places oil and gas producing rocks, such as mudstones and limestones next to oil and gas reservoirs, such as sandstones and some limestones. Understanding how the lithology and the facies/stratigraphic relationships interplay is very important in finding new petroleum resources. Using sequence stratigraphy as a model allows geologists to predict favorable locations of the source rock and reservoir.
Tar Sands
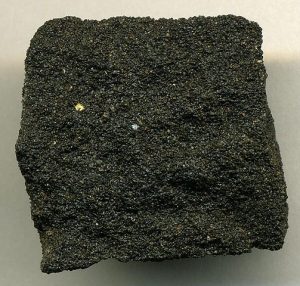
Conventional oil and gas, which is pumped from a reservoir, is not the only way to obtain hydrocarbons. There are a few fuel sources known as unconventional petroleum sources. However, they are becoming more important as conventional sources become scarce. Tar sands, or oil sands, are sandstones that contain petroleum products that are highly viscous, like tar, and thus cannot be drilled and pumped out of the ground readily like conventional oil. This unconventional fossil fuel is bitumen, which can be pumped as a fluid only at very low recovery rates and only when heated or mixed with solvents. So, using steam and solvent injections or directly mining tar sands to process later are ways to extract the tar from the sands. Alberta, Canada is known to have the largest tar sand reserves in the world. Note: as with ores, an energy resource becomes uneconomic if the total extraction and processing costs exceed the extracted material’s sales revenue. Environmental costs may also contribute to a resource becoming uneconomic.
Oil Shale
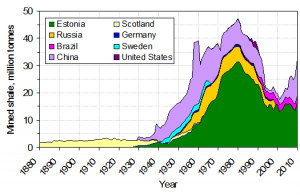
Oil shale, or tight oil, is a fine-grained sedimentary rock that has significant petroleum or natural gas quantities locked tightly in the sediment. Shale has high porosity but very low permeability and is a common fossil fuel source rock. To extract the oil directly from the shale, the material has to be mined and heated, which, like with tar sands, is expensive and typically has a negative environmental impact.
Fracking
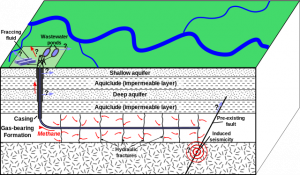
Another process used to extract the oil and gas from shale and other unconventional tight resources is called hydraulic fracturing, better known as fracking. In this method, high-pressure water, sand grains, and added chemicals are injected and pumped underground. Under high pressure, this creates and holds open fractures in the rocks, which help release the hard-to-access mostly natural gas fluids. Fracking is more useful in tighter sediments, especially shale, which has a high porosity to store the hydrocarbons but low permeability to allow transmission of the hydrocarbons. Fracking has become controversial because its methods contaminate groundwater and induce seismic activity. This has created much controversy between public concerns, political concerns, and energy value.
16.2.2. Coal
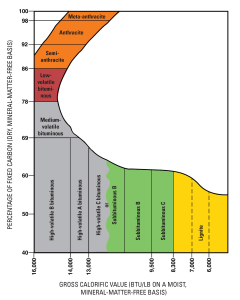
Coal comes from fossilized swamps, though some older coal deposits that predate terrestrial plants are presumed to come from algal buildups. Coal is chiefly carbon, hydrogen, nitrogen, sulfur, and oxygen, with minor amounts of other elements. As plant material is incorporated into sediments, heat and pressure cause several changes that concentrate the fixed carbon, which is the coal’s combustible portion. So, the more heat and pressure that coal undergoes, the greater is its carbon concentration and fuel value and the more desirable is the coal.
This is the general sequence of a swamp progressing through the various stages of coal formation and becoming more concentrated in carbon: Swamp => Peat => Lignite => Sub-bituminous => Bituminous => Anthracite => Graphite. As swamp materials collect on the swamp floor and are buried under accumulating materials, they first turn to peat.
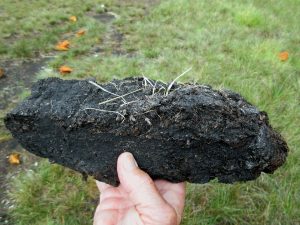
Peat itself is an economic fuel in some locations like the British Isles and Scandinavia. As lithification occurs, peat turns to lignite. With increasing heat and pressure, lignite turns to sub-bituminous coal, bituminous coal, and then, in a process like metamorphism, anthracite. Anthracite is the highest metamorphic grade and most desirable coal since it provides the highest energy output. With even more heat and pressure driving out all the volatiles and leaving pure carbon, anthracite can become graphite.
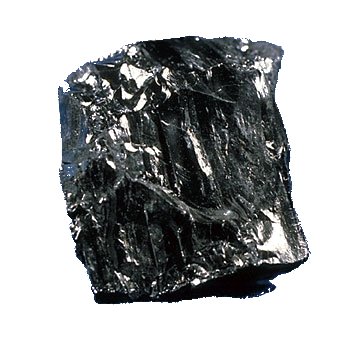
Humans have used coal for at least 6,000 years, mainly as a fuel source. Coal resources in Wales are often cited as a primary reason for Britain’s rise, and later, for the United States’ rise during the Industrial Revolution. According to the US Energy Information Administration, US coal production has decreased due to competing energy sources’ cheaper prices and due to society recognizing its negative environmental impacts, including increased very fine-grained particulate matter as an air pollutant, greenhouse gases, acid rain, and heavy metal pollution. Seen from this perspective, the coal industry as a source of fossil energy is unlikely to revive.
As the world transitions away from fossil fuels including coal, and manufacturing seeks strong, flexible, and lighter materials than steel including carbon fiber for many applications, current research is exploring coal as a source of this carbon.
Take this quiz to check your comprehension of this section.

16.3 Mineral Resources
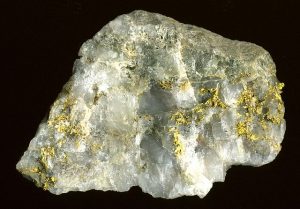
Mineral resources, while principally nonrenewable, are generally placed in two main categories: metallic, which contain metals, and nonmetallic, which contain other useful materials. Most mining has been traditionally focused on extracting metallic minerals. Human society has advanced significantly because we’ve developed the knowledge and technologies to yield metal from the Earth. This knowledge has allowed humans to build the machines, buildings, and monetary systems that dominate our world today. Locating and recovering these metals has been a key facet of geologic study since its inception. Every element across the periodic table has specific applications in human civilization. Metallic mineral mining is the source of many of these elements.
16.3.1. Types of Metallic Mineral Deposits
The various ways in which minerals and their associated elements concentrate to form ore deposits are too complex and numerous to fully review in this text. However, entire careers are built around them. In the following section, we describe some of the more common deposit types along with their associated elemental concentrations and world class occurrences.
Magmatic Processes
When a magmatic body crystallizes and differentiates (see Chapter 4), it can cause certain minerals and elements to concentrate. Layered intrusions, typically ultramafic to mafic, can host deposits that contain copper, nickel, platinum, palladium, rhodium, and chromium. The Stillwater Complex in Montana is an example of economic quantities of layered mafic intrusion. Associated deposit types can contain chromium or titanium-vanadium. The largest magmatic deposits in the world are the chromite deposits in the Bushveld Igneous Complex in South Africa. These rocks have an areal extent larger than the state of Utah. The chromite occurs in layers, which resemble sedimentary layers, except these layers occur within a crystallizing magma chamber.

Water and other volatiles that are not incorporated into mineral crystals when a magma crystallizes can become concentrated around the crystallizing magma’s margins. Ions in these hot fluids are very mobile and can form exceptionally large crystals. Once crystallized, these large crystal masses are then called pegmatites. They form from magma fluids that are expelled from the solidifying magma when nearly the entire magma body has crystallized. In addition to minerals that are predominant in the main igneous mass, such as quartz, feldspar, and mica, pegmatite bodies may also contain very large crystals of unusual minerals that contain rare elements like beryllium, lithium, tantalum, niobium, and tin, as well as native elements like gold. Such pegmatites are ores of these metals.
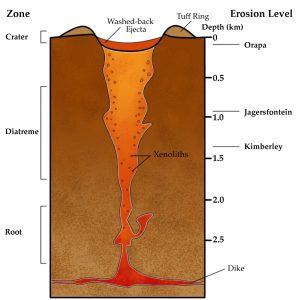
An unusual magmatic process is a kimberlite pipe, which is a volcanic conduit that transports ultramafic magma from within the mantle to the surface. Diamonds, which are formed at great temperatures and pressures of depth, are transported by a Kimberlite pipe to locations where they can be mined. The process that created these kimberlite ultramafic rocks is no longer common on Earth. Most known deposits are from the Archean Eon.
Hydrothermal Processes
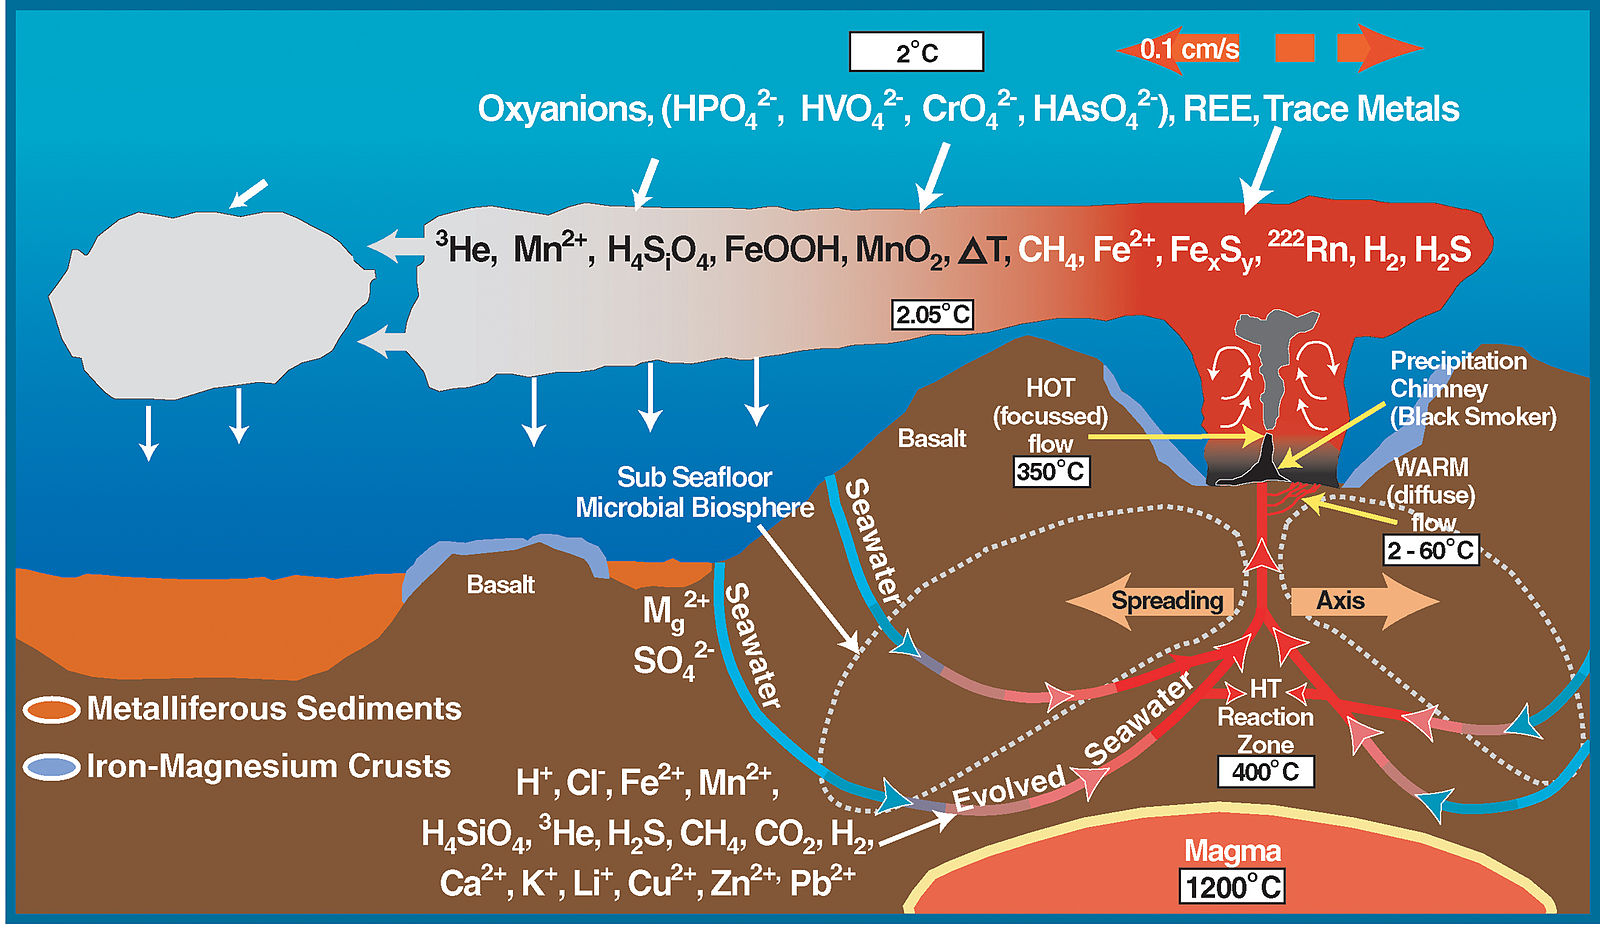
Fluids rising from crystallizing magmatic bodies or that are heated by the geothermal gradient cause many geochemical reactions that form various mineral deposits. The most active hydrothermal process today produces volcanogenic massive sulfide (VMS) deposits, which form from black smoker hydrothermal chimney activity near mid-ocean ridges all over the world. They commonly contain copper, zinc, lead, gold, and silver when found at the surface. Evidence from around 7000 BC in a period known as the Chalcolithic shows copper was among the earliest metals smelted by humans as means of obtaining higher temperatures were developed. The largest of these VMS deposits occur in Precambrian period rocks. The Jerome deposit in central Arizona is a good example.
Another deposit type that draws on magma-heated water is a porphyry deposit. This is not to be confused with the porphyritic igneous texture, although the name is derived from the porphyritic texture that is nearly always present in the igneous rocks associated with a porphyry deposit. Several types of porphyry deposits exist, such as porphyry copper, porphyry molybdenum, and porphyry tin. These deposits contain low-grade disseminated ore minerals closely associated with intermediate and felsic intrusive rocks that are present over a very large area. Porphyry deposits are typically the largest mines on Earth. One of the largest, richest, and possibly best studied mine in the world is Utah’s Kennecott Bingham Canyon Mine. It’s an open pit mine, which, for over 100 years, has produced several elements including copper, gold, molybdenum, and silver. Underground carbonate replacement deposits produce lead, zinc, gold, silver, and copper. In the mine’s past, the open pit predominately produced copper and gold from chalcopyrite and bornite. Gold only occurs in minor quantities in the copper-bearing minerals, but because the Kennecott Bingham Canyon Mine produces on such a large scale, it is one of the largest gold mines in the US. In the future, this mine may produce more copper and molybdenum (molybdenite) from deeper underground mines.
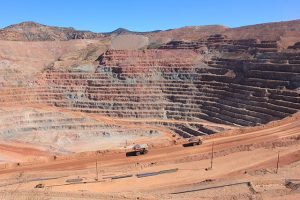
Most porphyry copper deposits owe their high metal content, and hence, their economic value to weathering processes called supergene enrichment which occurs when the deposit is uplifted, eroded, and exposed to oxidation. This process occurred millions of years after the initial igneous intrusion and hydrothermal expulsion ends. When the deposit’s upper pyrite-rich portion is exposed to rain, the pyrite in the oxidizing zone creates an extremely acid condition that dissolves copper out of copper minerals, such as chalcopyrite, and converts the chalcopyrite to iron oxides, such as hematite or goethite. The copper minerals are carried downward in water until they arrive at the groundwater table and an environment where the primary copper minerals are converted into secondary higher-copper content minerals. Chalcopyrite (35% Cu) is converted to bornite (63% Cu), and ultimately, chalcocite (80% Cu). Without this enriched zone, which is two to five times higher in copper content than the main deposit, most porphyry copper deposits would not be economic to mine.
If limestone or other calcareous sedimentary rocks are near the magmatic body, then another type of ore deposit called a skarn deposit forms. These metamorphic rocks form as magma-derived, highly saline metalliferous fluids react with carbonate rocks to create calcium-magnesium-silicate minerals like pyroxene, amphibole, and garnet, as well as high-grade iron, copper, zinc minerals, and gold. Intrusions that are genetically related to the intrusion that made the Kennecott Bingham Canyon deposit have also produced copper-gold skarns, which were mined by the early European settlers in Utah. When iron and/or sulfide deposits undergo metamorphism, the grain size commonly increases, which makes separating the gangue from the desired sulfide or oxide minerals much easier.
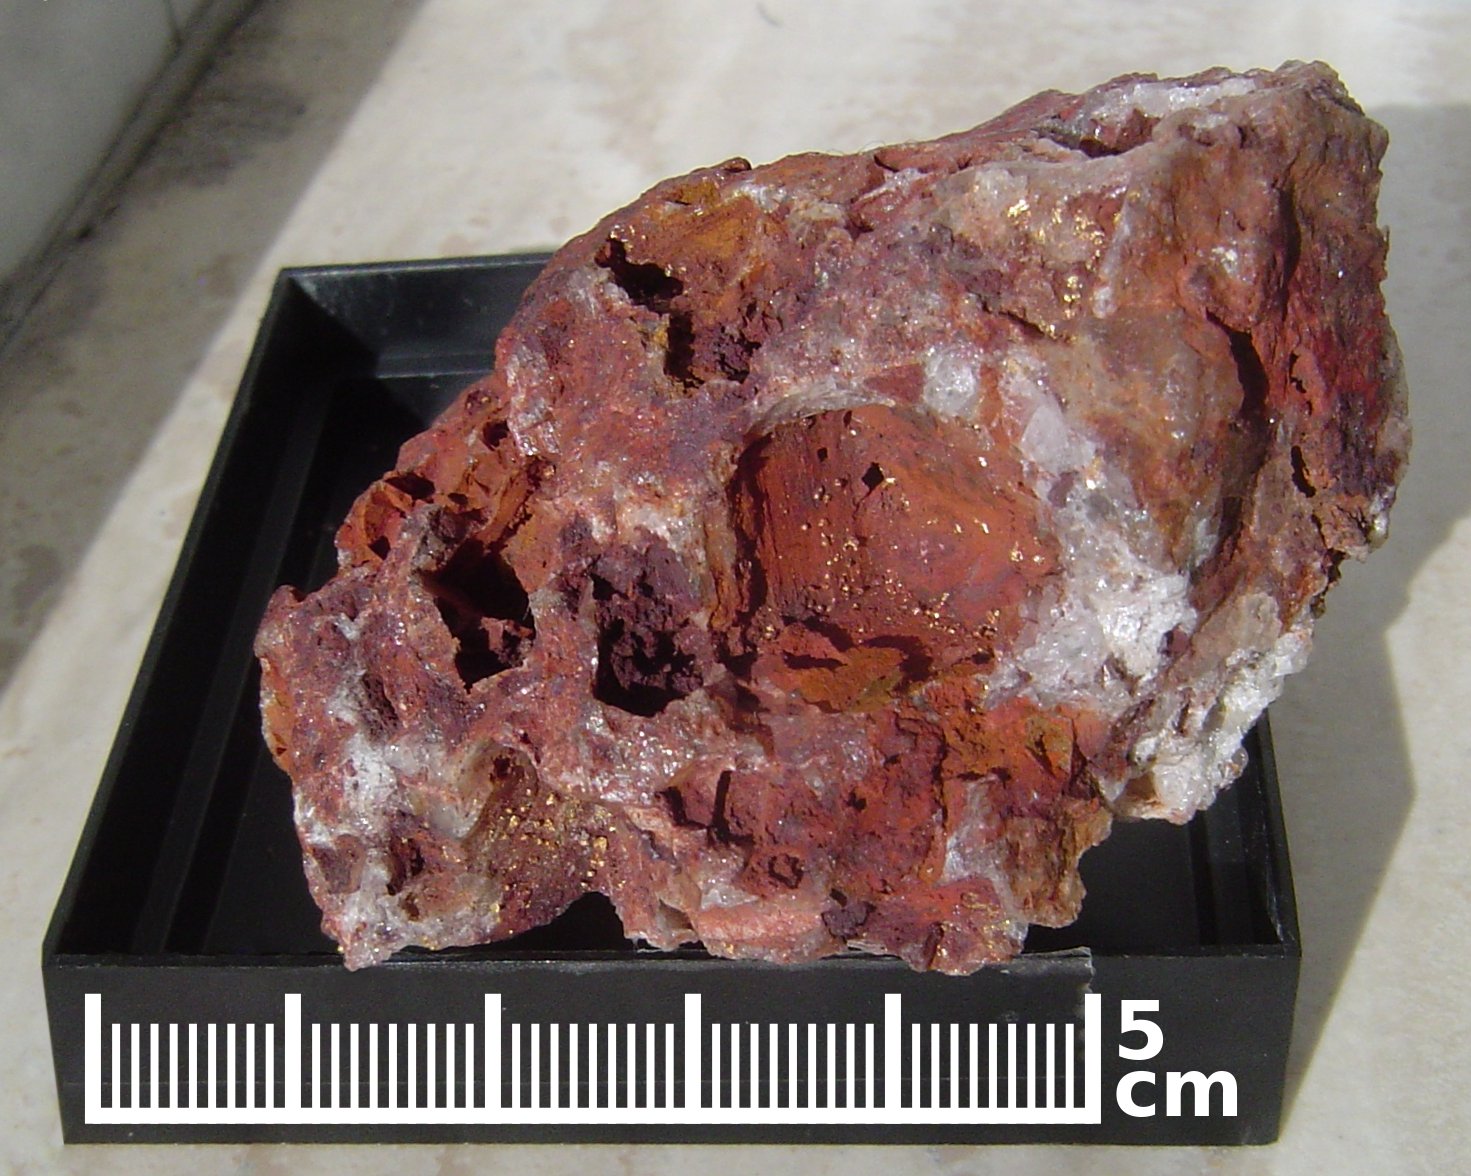
Sediment-hosted disseminated gold deposits consist of low concentrations of microscopic gold as inclusions and disseminated atoms in pyrite crystals. These are formed via low-grade hydrothermal reactions, generally in the realm of diagenesis, that occur in certain rock types, namely muddy carbonates and limey mudstones. This hydrothermal alteration is generally far removed from a magma source, but can be found in rocks situated with a high geothermal gradient. The Mercur deposit in Utah’s Oquirrh Mountains was this type’s earliest locally mined deposit. There, almost a million ounces of gold was recovered between 1890 and 1917. In the 1960s, a metallurgical process using cyanide was developed for these low-grade ore types. These deposits are also called Carlin-type deposits because the disseminated deposit near Carlin, Nevada, is where the new technology was first applied and where the first definitive scientific studies were conducted. Gold was introduced into these deposits by hydrothermal fluids that reacted with silty calcareous rocks, removing carbonate, creating additional permeability, and adding silica and gold-bearing pyrite in the pore space between grains. The Betze-Post mine and the Gold Quarry mine on the Carlin Trend are two of the largest disseminated gold deposits in Nevada. Similar deposits, but not as large, have been found in China, Iran, and Macedonia.
Non-magmatic Geochemical Processes
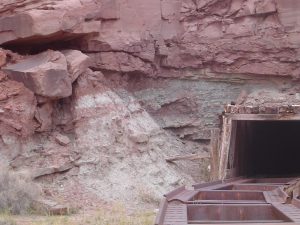
Geochemical processes that occur at or near the surface without magma’s aid also concentrate metals, but to a lesser degree than hydrothermal processes. One of the main reactions is redox, short for reduction/oxidation chemistry, which has to do with the amount of available oxygen in a system. Places where oxygen is plentiful, as in the atmosphere today, are considered oxidizing environments, while oxygen-poor places are considered reducing environments. Uranium deposits are an example of where redox concentrated the metal. Uranium is soluble in oxidizing groundwater environments and precipitates as uraninite when encountering reducing conditions. Many of the deposits across the Colorado Plateau, such as in Moab, Utah, were formed by this method.
Redox reactions are also responsible for creating banded iron formations (BIFs), which are interbedded layers of iron oxide—hematite and magnetite, chert, and shale beds. These deposits formed early in the Earth’s history as the atmosphere was becoming oxygenated. Cycles of oxygenating iron-rich waters initiated precipitation of the iron beds. Because BIFs are generally Precambrian in age, happening at the event of atmospheric oxygenation, they are only found in some of the older exposed rocks in the United States, such as in Michigan’s upper peninsula and northeast Minnesota.
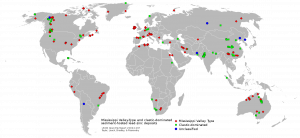
Deep, saline, connate fluids (trapped in pore spaces) within sedimentary basins may be highly metalliferous. When expelled outward and upward as basin sediments compacted, these fluids formed lead and zinc deposits in limestone by replacing or filling open spaces, such as caves and faults, and in sandstone by filling pore spaces. The most famous are called Mississippi Valley-type deposits. Also known as carbonate-hosted replacement deposits, they are large deposits of galena and sphalerite lead and zinc ores that form from hot fluids ranging from 100°C to 200°C (212°F to 392°F). Although they are named for occurring along the Mississippi River Valley in the US, they are found worldwide.
Sediment-hosted copper deposits occurring in sandstones, shales, and marls are enormous, and their contained resources are comparable to porphyry copper deposits. These deposits were most likely formed diagenetically by groundwater fluids in highly permeable rocks. Well-known examples are the Kupferschiefer in Europe, which has an areal coverage of >500,000 Km2, (310,685.596mi) and the Zambian Copper Belt in Africa.
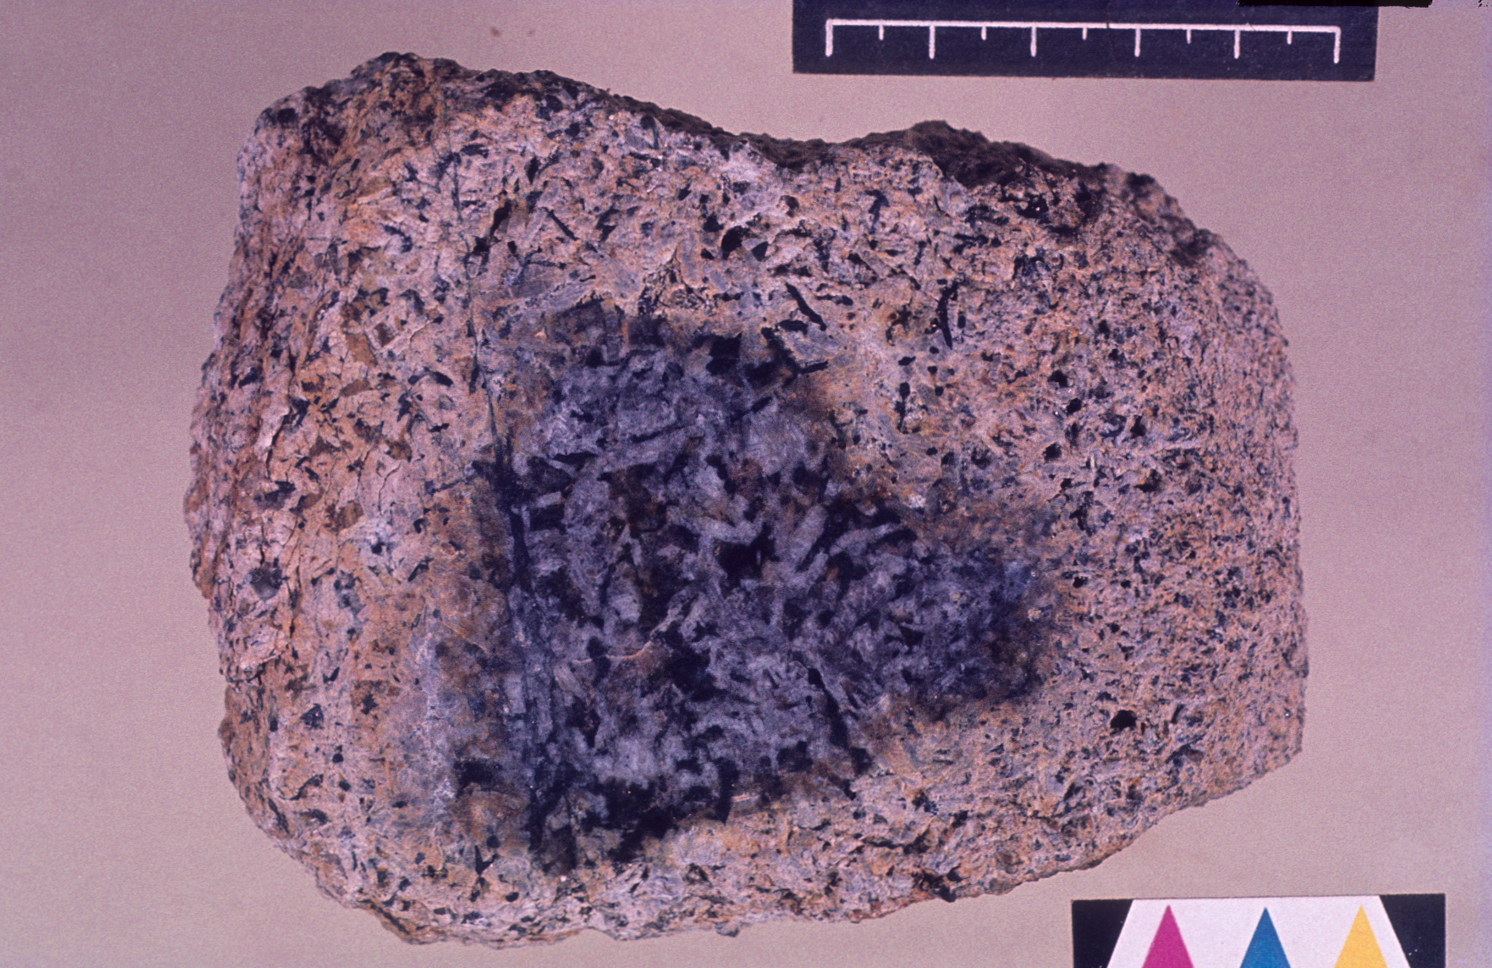
Soils and mineral deposits that are exposed at the surface experience deep and intense weathering, which can form surficial deposits. Bauxite, an aluminum ore, is preserved in karst topography and laterites, which are soils formed in wet tropical environments. Soils containing aluminum concentrate minerals, such as feldspar, and ferromagnesian minerals in igneous and metamorphic rocks, undergo chemical weathering processes that concentrate the metals. Ultramafic rocks that undergo weathering form nickel-rich soils, and when the magnetite and hematite in banded iron formations undergo weathering, it forms goethite, a friable mineral that is easily mined for its iron content.
Surficial Physical Processes
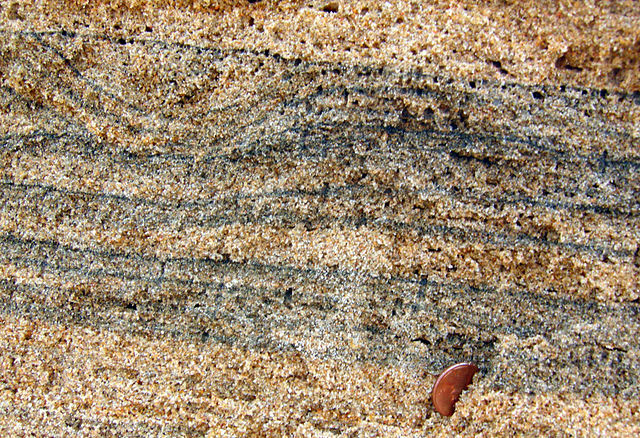
At the Earth’s surface, mass wasting and moving water can cause hydraulic sorting, which forces high-density minerals to concentrate. When these minerals are concentrated in streams, rivers, and beaches, they are called placer deposits, and occur in modern sands and ancient lithified rocks. Native gold, native platinum, zircon, ilmenite, rutile, magnetite, diamonds, and other gemstones can be found in placers. Humans have mimicked this natural process to recover gold manually by gold panning and by mechanized means such as dredging.
16.3.2. Environmental Impacts of Metallic Mineral Mining
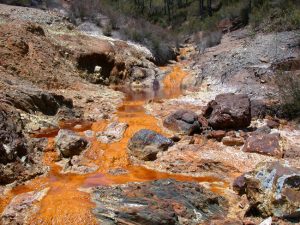
Metallic mineral mining’s primary impact comes from the mining itself, including disturbing the land surface, covering landscapes with tailings impoundments, and increasing mass wasting by accelerating erosion. In addition, many metal deposits contain pyrite, an uneconomic sulfide mineral, that when placed on waste dumps, generates acid rock drainage (ARD) during weathering. In oxygenated water, sulfides such as pyrite react and undergo complex reactions to release metal ions and hydrogen ions, which lowers pH to highly acidic levels. Mining and processing of mined materials typically increase the surface area to volume ratio in the material, causing chemical reactions to occur even faster than would occur naturally. If not managed properly, these reactions lead to acidic streams and groundwater plumes that carry dissolved toxic metals. In mines where limestone is a waste rock or where carbonate minerals like calcite or dolomite are present, their acid neutralizing potential helps reduce acid rock drainage. Although this is a natural process too, it is very important to isolate mine dumps and tailings from oxygenated water, both to prevent the sulfides from dissolving and subsequently percolating the sulfate-rich water into waterways. Industry has taken great strides to prevent contamination in recent decades, but earlier mining projects are still causing problems with local ecosystems.
16.3.3. Nonmetallic Mineral Deposits
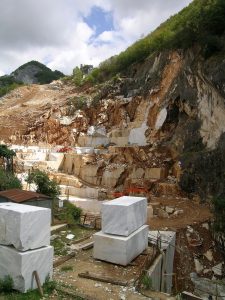
While receiving much less attention, nonmetallic mineral resources, also known as industrial minerals, are just as vital to ancient and modern society as metallic minerals. The most basic is building stone. Limestone, travertine, granite, slate, and marble are common building stones and have been quarried for centuries. Even today, building stones from slate roof tiles to granite countertops are very popular. Especially pure limestone is ground up, processed, and reformed as plaster, cement, and concrete. Some nonmetallic mineral resources are not mineral specific; nearly any rock or mineral can be used. This is generally called aggregate, which is used in concrete, roads, and foundations. Gravel is one of the more common aggregates.
Evaporites
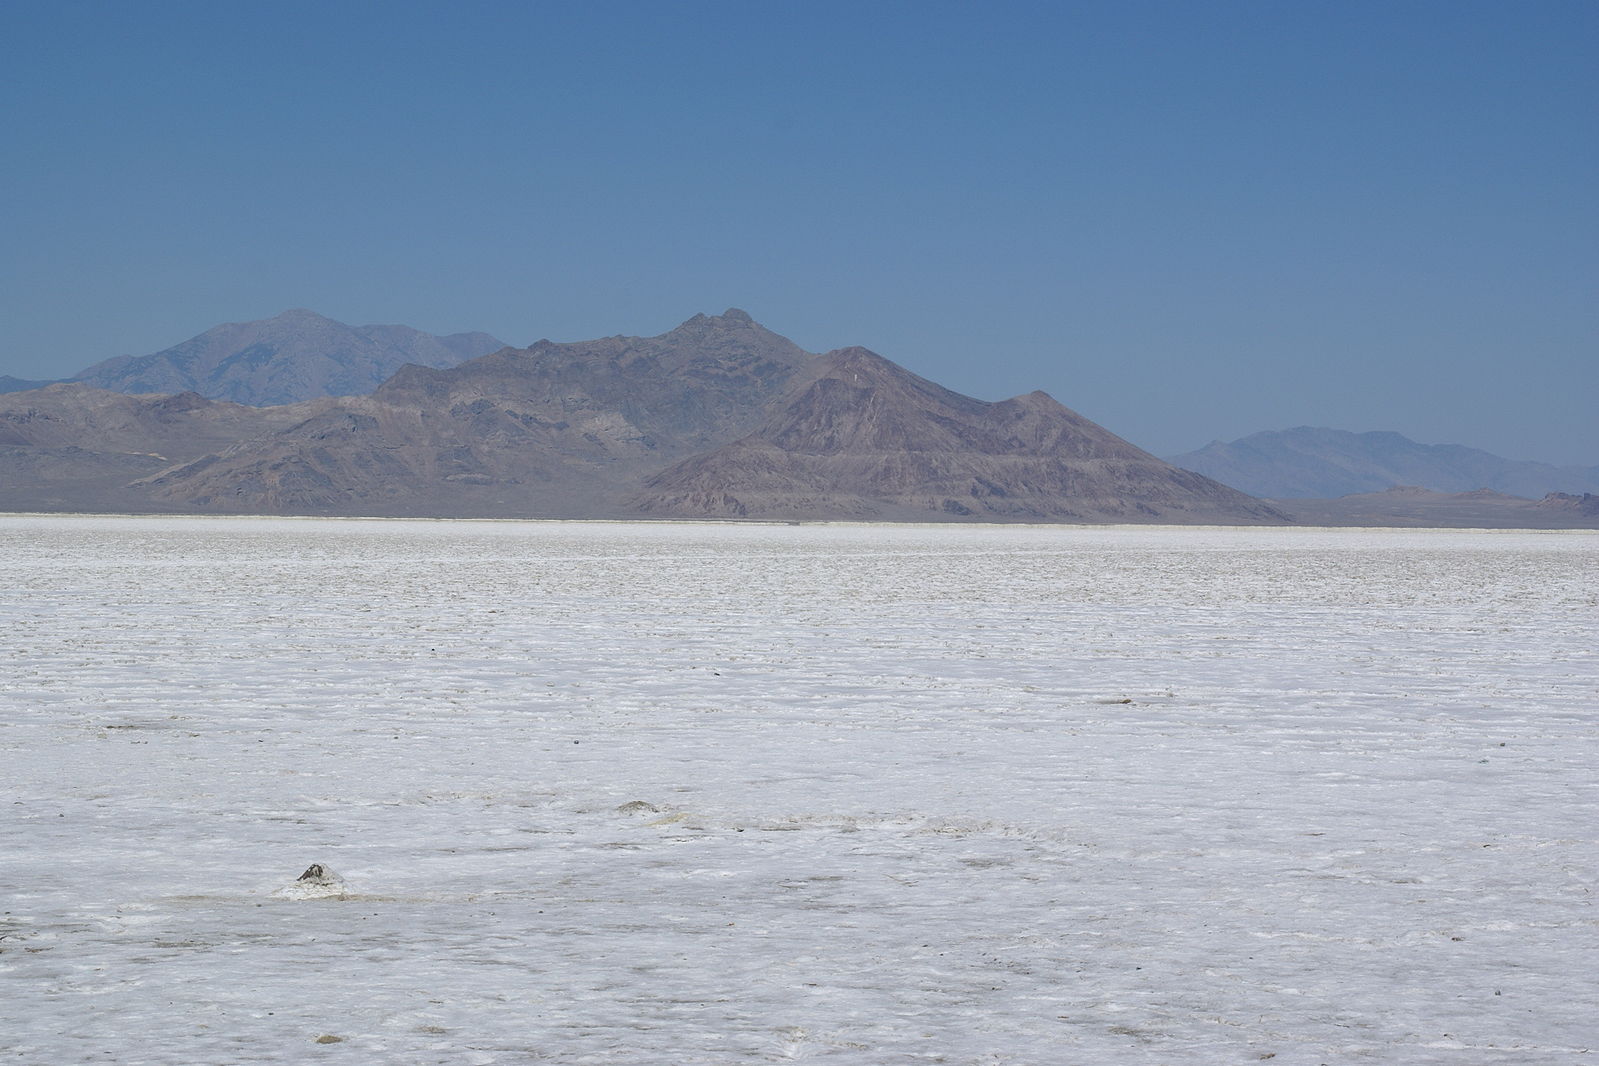
Evaporite deposits form in restricted basins where water evaporates faster than it recharges, such as the Great Salt Lake in Utah, or the Dead Sea, which borders Israel and Jordan. As the waters evaporate, soluble minerals are concentrated and become supersaturated, at which point they precipitate from the now highly-saline waters. If these conditions persist for long stretches, thick rock salt, rock gypsum, and other mineral deposits accumulate (see Chapter 5).
Evaporite minerals, such as halite, are used in our food as common table salt. Salt was a vitally important food preservative and economic resource before refrigeration was developed. While still used in food, halite is now mainly mined as a chemical agent, water softener, or road de-icer. Gypsum is a common nonmetallic mineral used as a building material; it is the main component in dry wall. It is also used as a fertilizer. Other evaporites include sylvite—potassium chloride, and bischofite—magnesium chloride, both of which are used in agriculture, medicine, food processing, and other applications. Potash, a group of highly soluble potassium-bearing evaporite minerals, is used as a fertilizer. In hyper-arid locations, even more rare and complex evaporites, like borax, trona, ulexite, and hanksite are mined. They can be found in places such as Searles Dry Lake and Death Valley, California, and in the Green River Formation’s ancient evaporite deposits in Utah and Wyoming.
Phosphorus
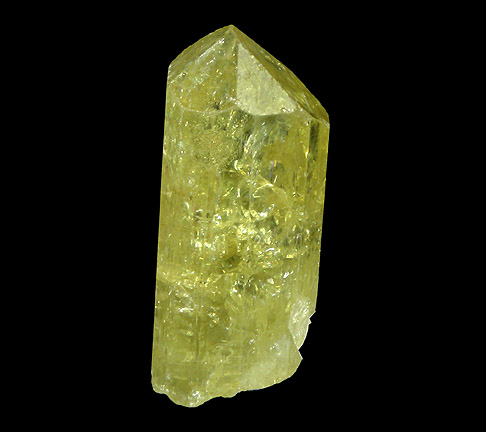
Phosphorus is an essential element that occurs in the mineral apatite, which is found in trace amounts in common igneous rocks. Phosphorite rock, which is formed in sedimentary environments in the ocean, contains abundant apatite and is mined to make fertilizer. Without phosphorus, life as we know it is not possible. Phosphorous is an important component of bone and DNA. Bone ash and guano are natural sources of phosphorus.
Take this quiz to check your comprehension of this section.

Summary
Energy and mineral resources are vital to modern society, and it is the role of the geologist to locate these resources for human benefit. As environmental concerns have become more prominent, the value of the geologist has not decreased, as they are still vital in locating the deposits and identifying the least intrusive methods of extraction.
Energy resources are general grouped as being renewable or nonrenewable. Geologists can aid in locating the best places to exploit renewable resources (e.g. locating a dam), but are commonly tasked with finding nonrenewable fossil fuels. Mineral resources are also grouped in two categories: metallic and nonmetallic. Minerals have a wide variety of processes that concentrate them to economic levels, and are usually mined via surface or underground methods.
Take this quiz to check your comprehension of this Chapter.

References
- Ague, Jay James, and George H. Brimhall. 1989. “Geochemical Modeling of Steady State Fluid Flow and Chemical Reaction during Supergene Enrichment of Porphyry Copper Deposits.” Economic Geology and the Bulletin of the Society of Economic Geologists 84 (3). economicgeology.org: 506–28.
- Arndt, N. T. 1994. “Chapter 1 Archean Komatiites.” In Developments in Precambrian Geology, edited by K.C. Condie, 11:11–44. Elsevier.
- Bárdossy, György, and Gerardus Jacobus Johannes Aleva. 1990. Lateritic Bauxites. Vol. 27. Elsevier Science Ltd.
- Barrie, C. T. 1999. “Volcanic-Associated Massive Sulfide Deposits: Processes and Examples in Modern and Ancient Settings.” Reviews in Economic Geology, v. 8. https://www.researchgate.net/profile/Michael_Perfit/publication/241276560_Geologic_petrologic_and_geochemical_relationships_between_magmatism_and_massive_sulfide_mineralization_along_the_eastern_Galapagos_Spreading_Center/links/02e7e51c8707bbfe9c000000.pdf.
- Barrie, L. A., and R. M. Hoff. 1984. “The Oxidation Rate and Residence Time of Sulphur Dioxide in the Arctic Atmosphere.” Atmospheric Environment 18 (12). Elsevier: 2711–22.
- Bauquis, Pierre-René. 1998. “What Future for Extra Heavy Oil and Bitumen: The Orinoco Case.” In Paper Presented by TOTAL at the World Energy Congress, 13:18.
- Belloc, H. 1913. The Servile State. T.N. Foulis.
- Blander, M., S. Sinha, A. Pelton, and G. Eriksson. 2011. “Calculations of the Influence of Additives on Coal Combustion Deposits.” Argonne National Laboratory, Lemont, Illinois. enersol.pk, 315.
- Boudreau, Alan E. 2016. “The Stillwater Complex, Montana--Overview and the Significance of Volatiles.” Mineralogical Magazine 80 (4). Mineralogical Society: 585–637.
- Bromfield, C. S., A. J. Erickson, M. A. Haddadin, and H. H. Mehnert. 1977. “Potassium-Argon Ages of Intrusion, Extrusion, and Associated Ore Deposits, Park City Mining District, Utah.” Economic Geology and the Bulletin of the Society of Economic Geologists 72 (5). economicgeology.org: 837–48.
- Brown, Valerie J. 2007. “Industry Issues: Putting the Heat on Gas.” Environmental Health Perspectives 115 (2). ncbi.nlm.nih.gov: A76.
- Cabri, Louis J., Donald C. Harris, and Thorolf W. Weiser. 1996. “Mineralogy and Distribution of Platinum-Group Mineral (PGM) Placer Deposits of the World.” Exploration and Mining Geology 2 (5). infona.pl: 73–167.
- Crutzen, Paul J., and Jos Lelieveld. 2001. “Human Impacts on Atmospheric Chemistry.” Annual Review of Earth and Planetary Sciences 29 (1). Annual Reviews 4139 El Camino Way, PO Box 10139, Palo Alto, CA 94303-0139, USA: 17–45.
- Delaney, M. L. 1998. “Phosphorus Accumulation in Marine Sediments and the Oceanic Phosphorus Cycle.” Global Biogeochemical Cycles 12 (4). Wiley Online Library: 563–72.
- Demaison, G. J., and G. T. Moore. 1980. “Anoxic Environments and Oil Source Bed Genesis.” Organic Geochemistry 2 (1). Elsevier: 9–31.
- Dott, Robert H., and Merrill J. Reynolds. 1969. “Sourcebook for Petroleum Geology.” American Association of Petroleum Geologists Tulsa, Okla. http://archives.datapages.com/data/specpubs/methodo1/data/a072/a072/0001/0000/vi.htm.
- Duffield, Wendell A. 2005. “Volcanoes, Geothermal Energy, and the Environment.” Volcanoes and the Environment. Cambridge University Press, 304.
- Einaudi, Marco T., and Donald M. Burt. 1982. “Introduction; Terminology, Classification, and Composition of Skarn Deposits.” Economic Geology and the Bulletin of the Society of Economic Geologists 77 (4). economicgeology.org: 745–54.
- Gandossi, Luca. 2013. “An Overview of Hydraulic Fracturing and Other Formation Stimulation Technologies for Shale Gas Production.” Eur. Commisison Jt. Res. Cent. Tech. Reports. skalunudujos.lt. http://skalunudujos.lt/wp-content/uploads/an-overview-of-hydraulic-fracturing-and-other-stimulation-technologies.pdf.
- Gordon, Mackenzie, Jr, Joshua I. Tracey Jr, and Miller W. Ellis. 1958. “Geology of the Arkansas Bauxite Region.” pubs.er.usgs.gov. https://pubs.er.usgs.gov/publication/pp299.
- Gordon, W. Anthony. 1975. “Distribution by Latitude of Phanerozoic Evaporite Deposits.” The Journal of Geology 83 (6). journals.uchicago.edu: 671–84.
- Haber, Fritz. 2002. “The Synthesis of Ammonia from Its Elements Nobel Lecture, June 2, 1920.” Resonance 7 (9). Springer India: 86–94.
- Hawley, Charles Caldwell. 2014. A Kennecott Story: Three Mines, Four Men, and One Hundred Years, 1887-1997. University of Utah Press.
- Hirsch, Robert L., Roger Bezdek, and Robert Wendling. 2006. “Peaking of World Oil Production and Its Mitigation.” AIChE Journal. American Institute of Chemical Engineers 52 (1). Wiley Subscription Services, Inc., A Wiley Company: 2–8.
- Hitzman, M., R. Kirkham, D. Broughton, J. Thorson, and D. Selley. 2005. “The Sediment-Hosted Stratiform Copper Ore System.” Economic Geology and the Bulletin of the Society of Economic Geologists 100th . eprints.utas.edu.au. http://eprints.utas.edu.au/705/.
- Hofstra, Albert H., and Jean S. Cline. 2000. “Characteristics and Models for Carlin-Type Gold Deposits.” Reviews in Economic Geology 13. Society of Economic Geologists: 163–220.
- James, L. P. 1979. Geology, Ore Deposits, and History of the Big Cottonwood Mining District, Salt Lake County, Utah. Bulletin (Utah Geological and Mineral Survey). Utah Geological and Mineral Survey, Utah Department of Natural Resources.
- Kim, Won-Young. 2013. “Induced Seismicity Associated with Fluid Injection into a Deep Well in Youngstown, Ohio.” Journal of Geophysical Research, [Solid Earth] 118 (7). Wiley Online Library: 3506–18.
- Klein, Cornelis. 2005. “Some Precambrian Banded Iron-Formations (BIFs) from around the World: Their Age, Geologic Setting, Mineralogy, Metamorphism, Geochemistry, and Origins.” The American Mineralogist 90 (10). Mineralogical Society of America: 1473–99.
- Laylin, James K. 1993. Nobel Laureates in Chemistry, 1901-1992. Chemical Heritage Foundation.
- Leach, D. L., and D. F. Sangster. 1993. “Mississippi Valley-Type Lead-Zinc Deposits.” Mineral Deposit Modeling: Geological. researchgate.net. https://www.researchgate.net/profile/Elisabeth_Rowan/publication/252527999_Genetic_link_between_Ouachita_foldbelt_tectonism_and_the_Mississippi_Valley-type_Lead-zinc_deposits_of_the_Ozarks/links/00b7d53c97ac2d6fe7000000.pdf.
- Lehmann, Bernd. 2008. “Uranium Ore Deposits.” Rev. Econ. Geol. AMS Online 2008. kenanaonline.com: 16–26.
- London, David, and Daniel J. Kontak. 2012. “Granitic Pegmatites: Scientific Wonders and Economic Bonanzas.” Elements 8 (4). GeoScienceWorld: 257–61.
- Mancuso, Joseph J., and Ronald E. Seavoy. 1981. “Precambrian Coal or Anthraxolite; a Source for Graphite in High-Grade Schists and Gneisses.” Economic Geology and the Bulletin of the Society of Economic Geologists 76 (4). economicgeology.org: 951–54.
- McKenzie, Hermione, and Barrington Moore. 1970. “Social Origins of Dictatorship and Democracy.” JSTOR. http://www.jstor.org/stable/27856441.
- Needham, Joseph, Ling Wang, and Gwei Djen Lu. 1963. Science and Civilisation in China. Vol. 5. Cambridge University Press Cambridge.
- Nuss, Philip, and Matthew J. Eckelman. 2014. “Life Cycle Assessment of Metals: A Scientific Synthesis.” PloS One 9 (7). journals.plos.org: e101298.
- Orton, E. 1889. The Trenton Limestone as a Source of Petroleum and Inflammable Gas in Ohio and Indiana. U.S. Government Printing Office.
- Palmer, M. A., E. S. Bernhardt, W. H. Schlesinger, K. N. Eshleman, E. Foufoula-Georgiou, M. S. Hendryx, A. D. Lemly, et al. 2010. “Science and Regulation. Mountaintop
- Mining Consequences.” Science 327 (5962). science.sciencemag.org: 148–49.
- Pratt, Wallace Everette. 1942. Oil in the Earth. University of Kansas Press.
- Quéré, C. Le, Robert Joseph Andres, T. Boden, T. Conway, R. A. Houghton, Joanna I. House, Gregg Marland, et al. 2013. “The Global Carbon Budget 1959--2011.” Earth System Science Data 5 (1). Copernicus GmbH: 165–85.
- Richards, J. P. 2003. “Tectono-Magmatic Precursors for Porphyry Cu-(Mo-Au) Deposit Formation.” Economic Geology and the Bulletin of the Society of Economic Geologists 98 (8). economicgeology.org: 1515–33.
- Rui-Zhong, Hu, Su Wen-Chao, Bi Xian-Wu, Tu Guang-Zhi, and Albert H. Hofstra. 2002. “Geology and Geochemistry of Carlin-Type Gold Deposits in China.” Mineralium Deposita 37 (3-4). Springer-Verlag: 378–92.
- Schröder, K-P, and Robert Connon Smith. 2008. “Distant Future of the Sun and Earth Revisited.” Monthly Notices of the Royal Astronomical Society 386 (1). mnras.oxfordjournals.org: 155–63.
- Semaw, Sileshi, Michael J. Rogers, Jay Quade, Paul R. Renne, Robert F. Butler, Manuel Dominguez-Rodrigo, Dietrich Stout, William S. Hart, Travis Pickering, and Scott W. Simpson. 2003. “2.6-Million-Year-Old Stone Tools and Associated Bones from OGS-6 and OGS-7, Gona, Afar, Ethiopia.” Journal of Human Evolution 45 (2). Academic Press: 169–77.
- Tappan, Helen, and Alfred R. Loeblich. 1970. “Geobiologic Implications of Fossil Phytoplankton Evolution and Time-Space Distribution.” Geological Society of America Special Papers 127 (January). specialpapers.gsapubs.org: 247–340.
- Taylor, E. L., T. N. Taylor, and M. Krings. 2009. Paleobotany: The Biology and Evolution of Fossil Plants. Elsevier Science.
- Tissot, B. 1979. “Effects on Prolific Petroleum Source Rocks and Major Coal Deposits Caused by Sea-Level Changes.” Nature 277. adsabs.harvard.edu: 463–65.
- Vail, P. R., R. M. Mitchum Jr, S. Thompson III, R. G. Todd, J. B. Sangree, J. M. Widmier, J. N. Bubb, and W. G. Hatelid. 1977. “Seismic Stratigraphy and Global Sea Level Changes.” Seismic Stratigraphy-Applications to Hydrocarbon Exploration, Edited by Payton, CE, Tulsa, American Association of Petroleum Geologists Memoir 26: 49–212.
- Vogel, J. C. 1970. “Groningen Radiocarbon Dates IX.” Radiocarbon 12 (2). journals.uair.arizona.edu: 444–71.
- Willemse, J. 1969. “The Geology of the Bushveld Igneous Complex, the Largest Repository of Magmatic Ore Deposits in the World.” Economic Geology Monograph 4: 1–22.
- Wrigley, E. A. 1990. Continuity, Chance and Change: The Character of the Industrial Revolution in England. Ellen McArthur Lectures ; 1987. Cambridge University Press.
- Youngquist, Walter. 1998. “Shale Oil--The Elusive Energy.” Hubbert Center Newsletter 4.

